Knob and Tube Wiring: How Many Homes Date From the Era, and What Insurers Do
- Primary data
- American Housing Survey 2023 national PUF v1.1; ACS 2025 1-year table B25034
- Data period
- AHS interviews 2023; ACS 2025
- Latest release used
- 2026-10-29
- Next release
- AHS 2025 national PUF (fieldwork 2025, release date not yet announced); ACS 2026 1-year in autumn 2027
- Geography
- United States; 50 states and DC
- Sources
- 33 (27 Tier 1)
In 2023, 14.9% of US homes built before 1940, the knob and tube wiring era, reported a blown fuse, exposed wiring or a room without a working outlet, versus 10.2% of homes built 2000 or later (ratio 1.46). The 2025 ACS counts 16.7 million pre-1940 homes; 6 of 9 insurer guidelines filed in Maine list the wiring as ineligible.
The market in brief
- No federal survey asks which wiring method a home has, so the number of US homes that still contain knob and tube wiring is unknown; this report measures the era and the symptoms instead.
- The ACS 2025 1-year estimates, released October 29, 2026, count 16.7 million housing units built 1939 or earlier, 11.3% of 148.2 million US homes.
- In the American Housing Survey 2023, 14.9% of occupied homes built before 1940 reported at least one of three electrical problems, against 10.2% of homes built 2000 or later, a ratio of 1.46 (standard error 0.08).
- The widest gaps are in the items least likely to reflect household habits: exposed wiring (4.0% vs 2.2%, ratio 1.82) and a room without a working wall outlet (2.5% vs 1.3%, ratio 1.92).
- Homes built in the 1930s report the highest rate of any decade, 18.4%, more than twice the 8.7% for homes built in the 2000s.
- Six of nine homeowners underwriting guidelines filed with the Maine Bureau of Insurance name knob and tube wiring: four bar any of it and two bar active knob and tube only.
- California and Washington allow insulation around existing knob and tube only after a licensed electrician certifies it; California's code bars it from hollow spaces filled with loose, rolled or foamed-in-place insulation.
- Owner-occupied homes built before 1940 were twice as likely as homes built 2000 or later to have had an electrical wiring, panel or lighting job in the prior 2 years (9.9% vs 4.9%), at a median reported cost of $1,500.
Knob and tube wiring was standard from about 1880 to the 1940s, and no survey counts what remains
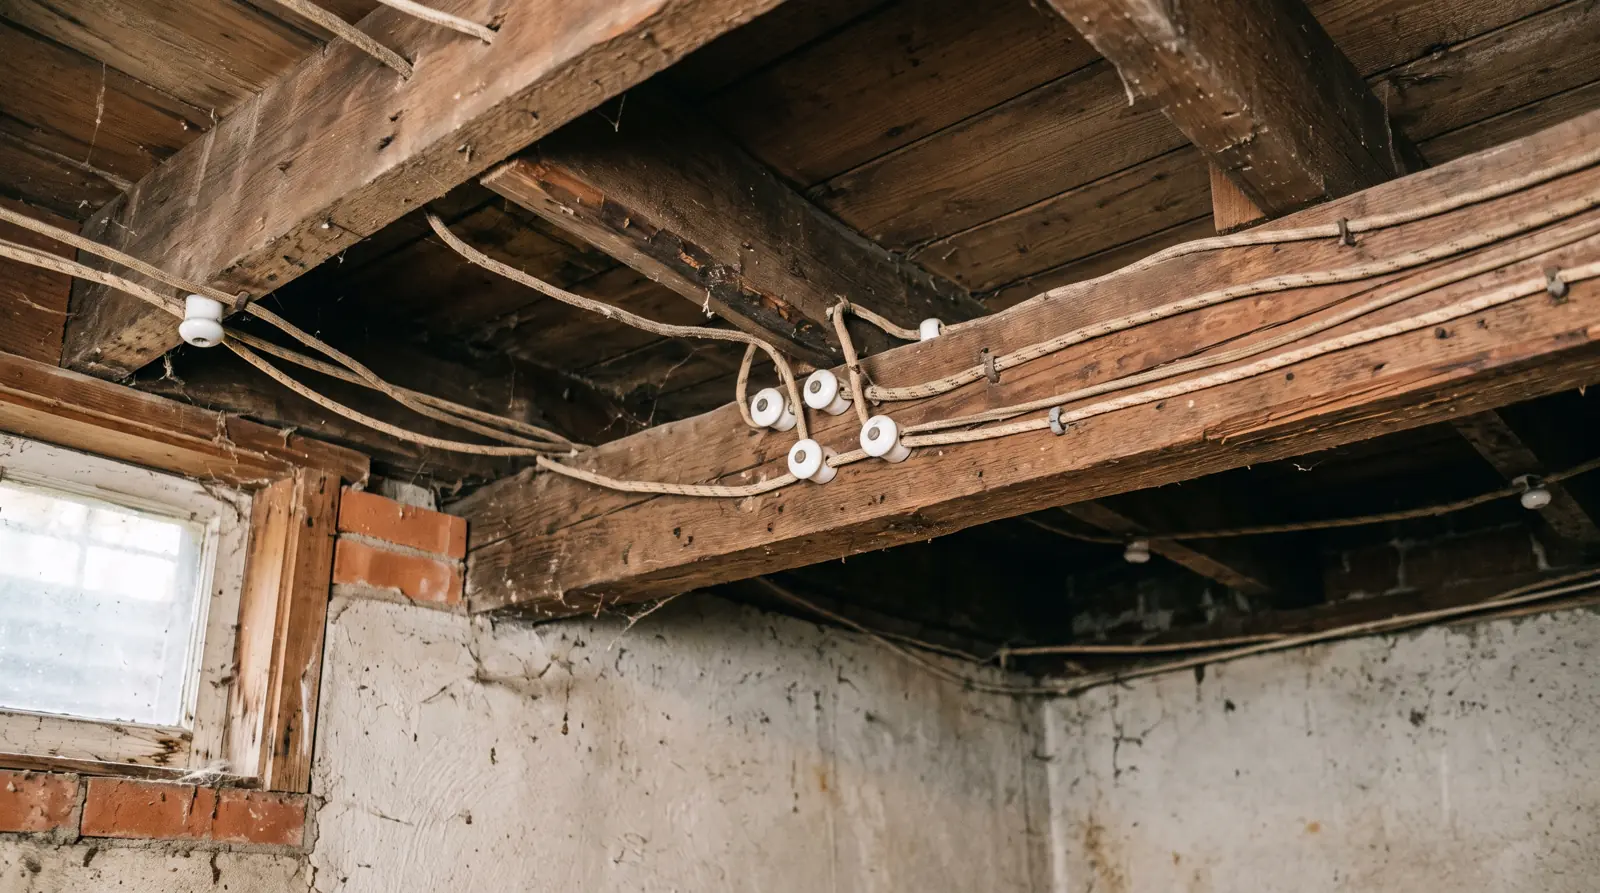
Knob and tube wiring ran single insulated copper conductors on porcelain knobs and through porcelain tubes. Local agencies date its common use from about 1880 into the 1940s. The federal housing surveys ask when a home was built, not how it is wired, so the era can be measured and the wiring cannot.
Knob and tube wiring: An early wiring method in which single insulated copper conductors are run through wall and ceiling cavities, pass through joists and studs inside porcelain tubes, and are supported along their length on nailed-down porcelain knobs (City of Menlo Park). The system has no ground wire (Center for Energy and Environment, 2025).
Tacoma Power tells customers that knob and tube was the standard wiring method in homes built between 1880 and 1950. The City of Menlo Park says it was used until the 1940s, Ontario's Electrical Safety Authority dates it to the early 1900s to 1940s, and the Minnesota Center for Energy and Environment says it was phased out in the 1940s.
The first National Electrical Code, the 1897 edition, already regulated it: according to a Fire Engineering summary, supports could be no more than 4.5 feet apart and wires carrying up to 300 volts had to be at least 2.5 inches apart. The same article notes that the method was labor-intensive and gave way to conduit and to metal-sheathed and nonmetallic-sheathed cable.
The era indicator is large. The ACS 2025 1-year table B25034 counts 16,741,814 housing units built 1939 or earlier, 11.3% of the US stock, and another 6,154,761 built in the 1940s, which brings the pre-1950 share to 15.4%. Many of those homes have been partly or fully rewired, so these counts are an upper bound on exposure, not a count of the wiring.
| Date | Event | Source |
|---|---|---|
| About 1880 | Start of the period in which, per Tacoma Power, knob and tube was the standard wiring method for homes (1880 to 1950) | Tacoma Power, Form 3504 |
| 1897 | First National Electrical Code; open wires on supports no more than 4.5 feet apart, wires up to 300 volts at least 2.5 inches apart | Fire Engineering (2008 summary) |
| 1940s | End of common use: used until the 1940s (Menlo Park); early 1900s to 1940s (ESA Ontario); phased out in the 1940s (CEE) | Menlo Park; ESA; CEE |
| 2003-01-25 | State Farm spokeswoman tells The Seattle Times there is no hard and fast rule on knob and tube; homes judged case by case | The Seattle Times |
| 2018-01 | Citizens sample 4-Point Inspection Form edition Insp4pt 01 18 asks inspectors to mark active knob and tube | Citizens Property Insurance Corporation |
| 2018-12-03 | Hannover Maine guidelines list aluminum and knob and tube wiring among ineligible risks | Hannover via Maine Bureau of Insurance |
| 2019-04-25 | Integon National Maine OneChoice guidelines: homes with knob and tube or aluminum wiring ineligible | Integon National via Maine Bureau of Insurance |
| 2021 | Ontario Electrical Safety Code 28th Edition deletes knob and tube installation rules | ESA Ontario Flash 25-05-FL |
| 2021-10-05 | Farmers Property and Casualty Maine guidelines: home with active knob and tube wiring ineligible | Farmers via Maine Bureau of Insurance |
| 2022-05 | ESA Flash 22-16-FL: many insurers will not provide or renew coverage on homes with knob and tube | ESA Ontario |
| 2022-12-09 | Farmers Casualty Maine guidelines: homes with active knob and tube wiring unacceptable | Farmers via Maine Bureau of Insurance |
| 2023-01-01 | State Farm Maine guidelines effective: dwelling with knob and tube wiring unacceptable | State Farm via Maine Bureau of Insurance |
| 2024-04-01 | Washington WAC 296-46B-394 amendment effective: insulation around knob and tube allowed on three conditions | Washington State Legislature |
| 2025-03-13 | ABC7 reports Bay Area insurers declining and canceling policies over knob and tube | ABC7 News |
| 2025-05 | ESA Flash 25-05-FL supersedes the 2022 notice | ESA Ontario |
| 2026-03-25 | Berkeley Form 146 revised, citing 2025 California Electrical Code section 394.12 item 5 | City of Berkeley |
| 2026-10-29 | ACS 2025 1-year released: 16,741,814 homes built 1939 or earlier | U.S. Census Bureau |
Dates are those printed on each source. Years for the start and end of common use are approximate and come from local agencies.
Source: [15][31][11][26][17] Tacoma Power (City of Tacoma); Fire Engineering; Washington State Legislature (Department of Labor and Industries rule); Electrical Safety Authority (Ontario, Canada); State Farm via Maine Bureau of Insurance (Internet Archive capture 2024-05-20)
Homes built before 1940 report exposed wiring 1.8 times as often as homes built since 2000
The American Housing Survey asks every occupied home three electrical questions. In 2023, homes built before 1940 answered yes more often on all three, and the gap is widest on exposed wiring and rooms without a working outlet.
The AHS 2023 national public use file records whether a fuse blew or a breaker tripped in the 3 months before the interview, whether finished living areas have exposed wiring, and whether any room lacks a working electric wall outlet. In 2023, 14.9% of occupied homes built before 1940 reported at least one of the three, compared with 11.6% of homes built 1940 to 1969, 10.7% of homes built 1970 to 1999 and 10.2% of homes built 2000 or later.
Share of occupied homes, 2023, by year built
Source: KBR analysis of Census/HUD American Housing Survey 2023 PUF v1.1
Item by item, pre-1940 homes reported exposed wiring at 4.0% vs 2.2% for homes built 2000 or later (ratio 1.82, SE 0.21), a room without a working outlet at 2.5% vs 1.3% (ratio 1.92, SE 0.3), three or more blown fuses or tripped breakers at 2.7% vs 1.5% (ratio 1.81, SE 0.24), and any blown fuse or tripped breaker at 10.1% vs 7.4% (ratio 1.37, SE 0.09). Standard errors come from the survey's 160 replicate weights.
| Item | Built before 1940 (%) | SE | 1940 to 1969 (%) | SE | 1970 to 1999 (%) | SE | 2000 or later (%) | SE | Ratio, before 1940 vs 2000+ | Ratio SE |
|---|---|---|---|---|---|---|---|---|---|---|
| Fuse blown or breaker tripped, last 3 months | 10.09 | 0.49 | 8.01 | 0.31 | 7.32 | 0.25 | 7.37 | 0.32 | 1.37 | 0.09 |
| 3 or more blown or tripped, last 3 months | 2.66 | 0.24 | 2.1 | 0.17 | 1.66 | 0.13 | 1.47 | 0.14 | 1.81 | 0.24 |
| Exposed wiring in living areas | 4.04 | 0.37 | 2.93 | 0.19 | 2.68 | 0.14 | 2.22 | 0.17 | 1.82 | 0.21 |
| Room without a working wall outlet | 2.53 | 0.25 | 1.76 | 0.16 | 1.61 | 0.13 | 1.32 | 0.13 | 1.92 | 0.3 |
| At least one of the three | 14.87 | 0.64 | 11.64 | 0.38 | 10.74 | 0.3 | 10.17 | 0.35 | 1.46 | 0.08 |
| Occupied homes (thousands) | 16267.0 | 31533.5 | 52642.9 | 32787.5 |
Universe: occupied units (INTSTATUS = 1). Fuse items use homes with electrical wiring (NOWIRE 1 or 2), as Census does. SE from 160 Fay replicate weights. Built 2000 or later includes 2010 to 2023.
Source: [1][3][5] U.S. Census Bureau and HUD; U.S. Census Bureau; U.S. Census Bureau
Applied to the 16.2 million wired, occupied pre-1940 homes, the 4.7 percentage point gap over the 2000-or-later rate equals about 764,000 homes with a warning sign beyond what newer homes report (SE about 117,000). None of the three items names the wiring method, so this is a measure of older homes' electrical condition, not of knob and tube itself.
The 1930s housing stock, the last full knob and tube decade, reports the most problems: 18.4%
Split by decade, the rate rises through the 1920s and 1930s and drops after 1940, when local agencies say knob and tube left common use. Homes built since 2010 tick back up on the fuse item.
Share with at least one of three items, by decade built, 2023
Source: KBR analysis of American Housing Survey 2023 PUF v1.1
In 2023, 13.6% of homes built in 1919 or earlier, 14.5% of 1920s homes and 18.4% of 1930s homes reported at least one of the three electrical items. The rate falls to 11.9% for the 1940s and 11.5% for the 1960s, and reaches its low of 8.7% for homes built in the 2000s, so 1930s homes report problems at 2.12 times the 2000s rate.
Homes built 2010 or later report 11.9%, mostly through the fuse item (8.8%). That fits the Census note that new occupants trip breakers while learning a home, and it is why the newest decade is not used as the baseline in the ratios above. The 1930s estimate rests on 1,153 sample cases, the smallest decade in the file, so its standard error is the widest (see table).
| Decade built | Sample cases | Occupied homes (thousands) | Any of three (%) | SE | Fuse or breaker (%) | Exposed wiring (%) | Room without outlet (%) |
|---|---|---|---|---|---|---|---|
| 1919 or earlier | 2643 | 7638.2 | 13.63 | 0.83 | 9.73 | 3.59 | 2.19 |
| 1920s | 1894 | 5375.9 | 14.48 | 0.97 | 10.0 | 3.85 | 2.63 |
| 1930s | 1153 | 3252.9 | 18.43 | 1.68 | 11.08 | 5.41 | 3.16 |
| 1940s | 2106 | 5584.5 | 11.93 | 0.92 | 8.32 | 3.19 | 1.15 |
| 1950s | 4633 | 12461.8 | 11.65 | 0.61 | 8.15 | 2.87 | 1.98 |
| 1960s | 5120 | 13487.1 | 11.51 | 0.52 | 7.75 | 2.87 | 1.8 |
| 1970s | 7232 | 18936.5 | 12.08 | 0.51 | 7.99 | 3.11 | 2.14 |
| 1980s | 6739 | 17574.4 | 10.2 | 0.51 | 6.77 | 2.83 | 1.33 |
| 1990s | 5833 | 16132.0 | 9.77 | 0.49 | 7.14 | 2.02 | 1.31 |
| 2000s | 6511 | 17745.1 | 8.69 | 0.43 | 6.16 | 1.87 | 1.13 |
| 2010 or later | 4663 | 15042.4 | 11.91 | 0.61 | 8.8 | 2.64 | 1.53 |
Any of three = blown fuse or tripped breaker in the last 3 months, exposed wiring, or a room without a working wall outlet.
Source: [1] U.S. Census Bureau and HUD
Five states hold 44.4% of pre-1940 homes; DC, New York and Massachusetts have the highest shares
The ACS 2025 count of homes built 1939 or earlier is the closest public proxy for where knob and tube could still be in walls. It concentrates in the Northeast and Midwest and is near zero in the Sun Belt.
Share of housing units built 1939 or earlier, 2025, top 15
Source: Census ACS 2025 1-year, table B25034
By count, New York has 2.6 million homes built 1939 or earlier, Pennsylvania 1.4 million, California 1.3 million, Illinois 1.1 million and Ohio 1.0 million; together they hold 7.4 million, or 44.4% of the national total. By share, the District of Columbia (31.9%), New York (30.1%), Massachusetts (30.0%), Rhode Island (27.7%) and Pennsylvania (23.5%) lead, and 9 jurisdictions are at 20% or more.
At the other end, homes built before 1940 make up 1.2% of housing in Nevada, 1.3% in Arizona, 1.6% in Alaska and 1.8% in Florida. For median home ages and the 30 to 49 year band, see How old is my house?; this table covers only the pre-1940 band.
Show all 52 rows
| Rank by share | State | Housing units 2025 | Built 1939 or earlier | MOE (90%) | Share built 1939 or earlier (%) | Share MOE (pp) | Rank by count |
|---|---|---|---|---|---|---|---|
| 1 | District of Columbia | 371597 | 118461 | 5445 | 31.9 | 1.5 | 32 |
| 2 | New York | 8738202 | 2634166 | 25493 | 30.1 | 0.3 | 1 |
| 3 | Massachusetts | 3072185 | 921016 | 16714 | 30.0 | 0.5 | 6 |
| 4 | Rhode Island | 489071 | 135553 | 7437 | 27.7 | 1.5 | 29 |
| 5 | Pennsylvania | 5881903 | 1381651 | 21793 | 23.5 | 0.4 | 2 |
| 6 | Vermont | 346275 | 79940 | 4124 | 23.1 | 1.2 | 37 |
| 7 | Iowa | 1467164 | 329471 | 8606 | 22.5 | 0.6 | 14 |
| 8 | Maine | 771487 | 172953 | 7046 | 22.4 | 0.9 | 26 |
| 9 | Illinois | 5503532 | 1117920 | 20691 | 20.3 | 0.4 | 4 |
| 10 | Connecticut | 1558234 | 299282 | 10644 | 19.2 | 0.7 | 16 |
| 11 | Ohio | 5367633 | 1011876 | 15125 | 18.9 | 0.3 | 5 |
| 12 | Nebraska | 890794 | 167239 | 5648 | 18.8 | 0.6 | 28 |
| 13 | New Hampshire | 662142 | 120840 | 5703 | 18.2 | 0.9 | 30 |
| 14 | New Jersey | 3827544 | 682903 | 14357 | 17.8 | 0.4 | 7 |
| 15 | Wisconsin | 2838967 | 500543 | 10530 | 17.6 | 0.4 | 9 |
| 16 | Minnesota | 2614529 | 391988 | 8551 | 15.0 | 0.3 | 11 |
| 17 | Indiana | 3052617 | 451454 | 10241 | 14.8 | 0.3 | 10 |
| 18 | Kansas | 1318100 | 189562 | 6115 | 14.4 | 0.5 | 22 |
| 19 | South Dakota | 429629 | 61701 | 3321 | 14.4 | 0.8 | 40 |
| 20 | Michigan | 4692331 | 657410 | 13995 | 14.0 | 0.3 | 8 |
| 21 | West Virginia | 871887 | 117148 | 5394 | 13.4 | 0.6 | 33 |
| 22 | Missouri | 2876147 | 376444 | 7904 | 13.1 | 0.3 | 12 |
| 23 | Montana | 544232 | 68849 | 3934 | 12.7 | 0.7 | 39 |
| 24 | Wyoming | 283770 | 29632 | 3358 | 10.4 | 1.2 | 48 |
| 25 | Oregon | 1909202 | 196799 | 7573 | 10.3 | 0.4 | 21 |
| 26 | Maryland | 2613898 | 266648 | 9422 | 10.2 | 0.4 | 17 |
| 27 | North Dakota | 384247 | 38239 | 2766 | 10.0 | 0.7 | 46 |
| 28 | Washington | 3436809 | 310214 | 10356 | 9.0 | 0.3 | 15 |
| 29 | California | 14994887 | 1284468 | 18621 | 8.6 | 0.1 | 3 |
| 30 | Kentucky | 2070375 | 178997 | 7380 | 8.6 | 0.4 | 24 |
| 31 | Delaware | 483497 | 36220 | 3677 | 7.5 | 0.8 | 47 |
| 32 | Virginia | 3779307 | 265421 | 9485 | 7.0 | 0.3 | 18 |
| 33 | Idaho | 849162 | 58334 | 4046 | 6.9 | 0.5 | 41 |
| 34 | Oklahoma | 1816238 | 120602 | 3908 | 6.6 | 0.2 | 31 |
| 35 | Colorado | 2692470 | 175417 | 7301 | 6.5 | 0.3 | 25 |
| 36 | Utah | 1307030 | 75180 | 4440 | 5.8 | 0.3 | 38 |
| 37 | Louisiana | 2156514 | 115538 | 6195 | 5.4 | 0.3 | 34 |
| 38 | Tennessee | 3291174 | 172409 | 7257 | 5.2 | 0.2 | 27 |
| 39 | North Carolina | 5167865 | 246000 | 10382 | 4.8 | 0.2 | 19 |
| 40 | Alabama | 2406299 | 106439 | 6313 | 4.4 | 0.3 | 35 |
| 41 | New Mexico | 981598 | 42426 | 3569 | 4.3 | 0.4 | 45 |
| 42 | Georgia | 4733611 | 185071 | 8158 | 3.9 | 0.2 | 23 |
| 43 | Mississippi | 1369517 | 52803 | 4360 | 3.9 | 0.3 | 43 |
| 44 | Arkansas | 1435529 | 53599 | 4210 | 3.7 | 0.3 | 42 |
| 45 | South Carolina | 2579738 | 86144 | 5118 | 3.3 | 0.2 | 36 |
| 46 | Hawaii | 574519 | 18207 | 2553 | 3.2 | 0.4 | 49 |
| 47 | Texas | 12847964 | 373311 | 11965 | 2.9 | 0.1 | 13 |
| 48 | Florida | 10788709 | 199292 | 9008 | 1.8 | 0.1 | 20 |
| 49 | Alaska | 330538 | 5125 | 1073 | 1.6 | 0.3 | 51 |
| 50 | Arizona | 3373271 | 44904 | 4321 | 1.3 | 0.1 | 44 |
| 51 | Nevada | 1385027 | 16005 | 2798 | 1.2 | 0.2 | 50 |
| United States | 148228967 | 16741814 | 73641 | 11.3 | 0.0 |
ACS 2025 1-year, B25034_E011 over B25034_E001. MOE at 90 percent. Share MOE uses the Census formula for derived proportions.
As a cross-check, the AHS 2023 estimate of 16.3 million occupied pre-1940 homes equals 97.2% of the ACS 2025 count of all units built 1939 or earlier, which also includes vacant homes. The two surveys use different years and universes, so the match is a sanity check, not a reconciliation.
Six of nine insurer guidelines filed in Maine name knob and tube wiring
Insurers rarely publish underwriting rules, but Maine's insurance regulator posts the homeowners guidelines that insurers file with it. Of nine found, six name knob and tube wiring as a reason a home is ineligible or unacceptable.
State Farm's Maine guidelines, effective January 1, 2023 and produced under a Maine Bureau of Insurance data call, list "a dwelling with" knob and tube wiring under unacceptable building service equipment. Hannover (effective December 3, 2018) and both Integon National editions (April 25, 2019 and an undated OneChoice and Premier Client edition) list knob and tube wiring among ineligible risks. Two Farmers editions (October 5, 2021 and December 9, 2022) bar only active knob and tube wiring.
Three files do not name it: USAA (February 24, 2023) bars dwellings with inadequate or faulty wiring or insufficient amperage, an unnamed insurer form PL-12430 requires circuit breakers in whole or in part, and the Chubb file (August 1, 2022) has no wiring rule. That puts the count at 6 of 9, or 66.7%. These are 2018 to 2023 editions read through archived copies, and insurers may have revised them since.
| Insurer (writing company) | Guideline date | Knob and tube wording | Coded as |
|---|---|---|---|
| State Farm | 2023-01-01 | Unacceptable: a dwelling with knob & tube wiring | Bars any knob and tube |
| Hannover | 2018-12-03 | Home ineligible risks, system requirements: aluminum and knob & tube wiring | Bars any knob and tube |
| Integon National (OneChoice) | 2019-04-25 | Ineligible: knob & tube or aluminum wiring present | Bars any knob and tube |
| Integon National (OneChoice and Premier Client) | Undated, file created 2020-10-12 | Ineligible: knob & tube or aluminum wiring present | Bars any knob and tube |
| Farmers Property and Casualty | 2021-10-05 | Ineligible if the home contains active knob and tube wiring | Bars active only |
| Farmers Casualty (FCAS) | 2022-12-09 | Unacceptable risks: homes with active knob & tube wiring | Bars active only |
| USAA | 2023-02-24 | Not named; bars inadequate or faulty wiring or insufficient amperage | General wiring rule |
| Unnamed insurer, form PL-12430 | Form edition 01-07 | Not named; circuit breakers required in whole or in part | Not named |
| Chubb writing companies | 2022-08-01 | No electrical or wiring rule in the file | Not named |
Guideline files hosted by the Maine Bureau of Insurance, read through Internet Archive captures (maine.gov blocked automated access). Editions 2018 to 2023; current versions may differ.
Source: [17][18][19][20][21][22][23][24][25] State Farm via Maine Bureau of Insurance (Internet Archive capture 2024-05-20); Farmers via Maine Bureau of Insurance (Internet Archive capture 2024-05-17); Farmers via Maine Bureau of Insurance (Internet Archive capture 2024-05-18); Hanover Insurance Group via Maine Bureau of Insurance (Internet Archive capture 2024-07-19); Integon National via Maine Bureau of Insurance (Internet Archive capture 2024-05-18); Integon National via Maine Bureau of Insurance (Internet Archive capture 2024-05-17); USAA via Maine Bureau of Insurance (Internet Archive capture 2024-05-20); Chubb via Maine Bureau of Insurance (Internet Archive capture 2024-07-19); Unnamed insurer via Maine Bureau of Insurance (Internet Archive capture 2024-05-17)
In Florida, Citizens Property Insurance Corporation publishes a sample 4-Point Inspection Form (Insp4pt 01 18) whose electrical section asks the inspector to check cloth wiring, active knob and tube, and branch circuit aluminum wiring. The form says underwriting will rely on it to determine insurability. Citizens' full underwriting manual was not found in an openable copy, so this report does not state Citizens' eligibility rule.
Reporting shows the rules tightening over time. In 2003 a State Farm spokeswoman told The Seattle Times the company had no hard and fast rule on knob and tube in Washington and judged each home case by case. In March 2025, ABC7 San Francisco reported insurers declining and canceling Bay Area policies over it, while the San Francisco Fire Department told the station it had not seen trends in knob and tube residential fires. Ontario's Electrical Safety Authority wrote in 2022, and again in 2025, that many insurers there will not provide or renew coverage.
Insulation packed around live knob and tube is a code question in California and Washington
Knob and tube conductors were designed to run in open air, held away from wood. Codes treat burying them in insulation as a separate issue from simply leaving them in place.
California Electrical Code section 394.12 item 5, quoted on Berkeley Form 146 and the Menlo Park building page, says concealed knob and tube shall not be used in hollow spaces of walls, ceilings and attics insulated with loose, rolled or foamed-in-place material that envelops the conductors. An exception allows insulation if a licensed electrical contractor certifies the wiring is in good condition, the certificate is filed, bilingual caution notices are posted at attic accesses, and the insulation is noncombustible with no conductive material.
Washington's rule WAC 296-46B-394, amended effective April 1, 2024, reads NEC Article 394 as allowing loose or rolled insulation around existing knob and tube on three conditions: a licensed contractor certifies the wiring to the state, the insulation is Class I with a flame spread of 25 or less and is not foam, and every circuit has overcurrent protection matched to NEC Table 310.16's 60 degree column by breakers or Type S fuses.
The concern is heat. Fire Engineering describes knobs that held each wire at least half an inch off the framing, and an inspection firm's explainer says packed insulation stops the wire covering from shedding heat. Tacoma Power requires an electrician's inspection before an insulation project in its rebate and loan program, citing improper splices, damaged knobs and oversized fuses or breakers; its form lists 15 amp protection for 14 gauge and 20 amp for 12 gauge conductors. For attic insulation that may itself be a hazard, see vermiculite insulation.
Electrical jobs in pre-1940 owner homes: twice as common, at a median $1,500
No public dataset prices knob and tube replacement. The AHS does record what owners spent on electrical wiring, panel and built-in lighting jobs, which is the closest sourced cost figure, and it shows older homes doing this work more often.
Owner homes with a wiring, panel or lighting job in 2 years
Source: KBR analysis of American Housing Survey 2023 PUF v1.1, project file
In the 2 years before the 2023 survey, 9.9% of owner-occupied homes built before 1940 had an electrical wiring, fuse box, breaker panel or built-in lighting job, against 4.9% of homes built 2000 or later, a ratio of 2.01. The weighted median reported cost of those jobs was $1,500 in pre-1940 homes (289 sample jobs, mean $3,570) and $700 in homes built 2000 or later (315 sample jobs). Across all owner homes the median was $1,000.
| Year built (owner-occupied homes) | Homes with an electrical job in last 2 years (%) | SE | Jobs with cost reported (thousands) | Median job cost ($) | Mean job cost ($) | Sample jobs |
|---|---|---|---|---|---|---|
| Before 1940 | 9.91 | 0.6 | 901.3 | 1500 | 3570 | 289 |
| 1940 to 1969 | 8.78 | 0.41 | 1739.6 | 1000 | 3298 | 550 |
| 1970 to 1999 | 7.94 | 0.35 | 2617.3 | 1000 | 2679 | 841 |
| 2000 or later | 4.93 | 0.33 | 1039.7 | 700 | 2242 | 315 |
| All owner homes | 7.59 | 0.22 | 6297.9 | 1000 | 2905 | 1995 |
AHS job type 23: added or replaced electrical wiring, fuse boxes, breaker panels, or built-in lighting, in the 2 years before the interview. Costs are rounded and topcoded on the PUF. Not a knob and tube replacement price.
Source: [1][4] U.S. Census Bureau and HUD; U.S. Census Bureau
These figures mix small jobs with whole-house rewiring, and the public file rounds and topcodes costs, so they are not a rewiring price. Two of the pages that rank for this topic quote replacement ranges of $3,500 to $8,000 (Waypoint) and $5,000 to $10,000 for a 1,500 to 3,000 square foot home (Mr. Electric), with no source or method; they are reported here as claims and not used as data. For how electrical work fits a remodel budget, see bathroom remodel cost.
Is knob and tube wiring dangerous? Federal fire data cannot single it out
National fire statistics count electrical malfunction fires but do not record the wiring method, so there is no published US fire rate for knob and tube. Regulators point to age, alterations and insulation as the risk factors.
The U.S. Fire Administration estimates 23,700 residential building electrical malfunction fires in 2023, with 305 deaths, 800 injuries and $1.5 billion in losses; deaths fell 19% from 2014 to 2023. Those totals cover all wiring types and appliances.
Ontario's Electrical Safety Authority lets existing knob and tube stay in service if it is protected by a 15 amp fuse or breaker, has no added outlets and looks sound, and lists the unsafe changes it sees: oversized 20 or 30 amp fuses, extension cords used as permanent wiring, new receptacles tapped onto old circuits and removed ground pins. The Center for Energy and Environment adds that the rubber insulation turns brittle with heat and age. The AHS signal above is consistent with that picture of aging, altered systems; it does not prove that knob and tube itself fails more often.
Older two-prong circuits also intersect the GFCI rules covered in GFCI requirements by NEC edition, which this report does not repeat.
What a kitchen or bath remodel in a pre-1940 house runs into
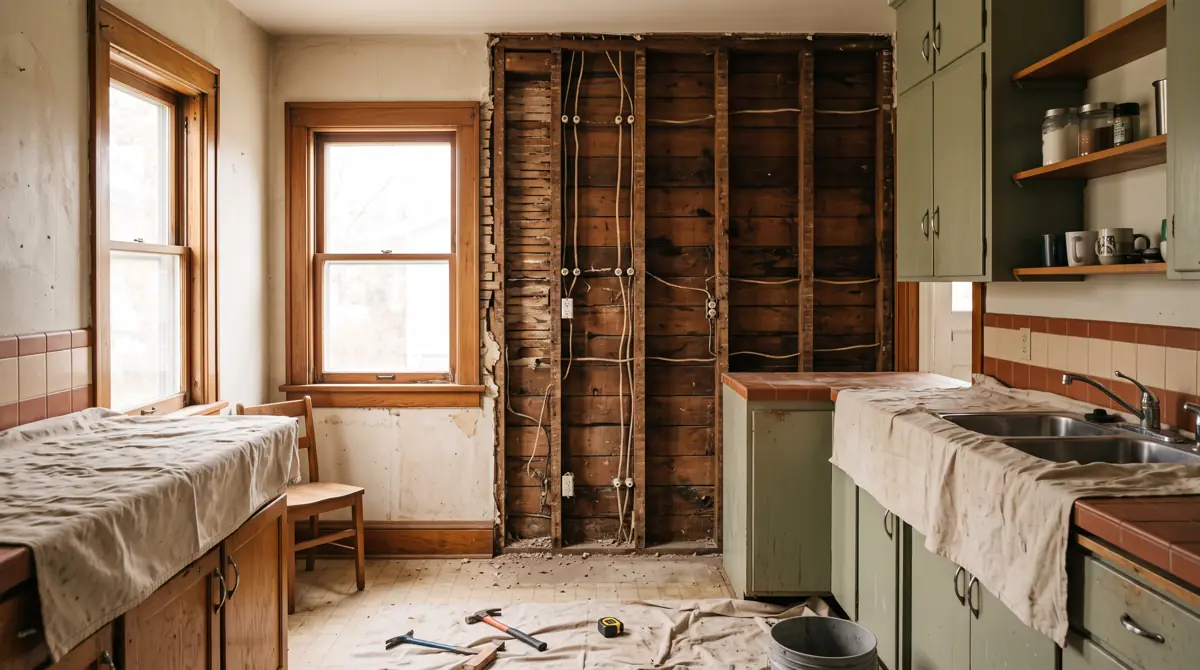
A remodel is when old wiring gets exposed, and building departments treat new work and old work differently. Local permit rules, not national data, decide what must change.
The City of Menlo Park states that new knob and tube installation is no longer allowed under the California Electrical Code except by special permission, and recommends that knob and tube found during construction be removed entirely or in part to the maximum extent practical. Berkeley requires permits and inspections, and Washington requires inspection, for repairs, alterations or extensions of an existing system (Form 146, WAC 296-46B-394).
Opening plaster in a pre-1940 kitchen or bath can also disturb lead paint and asbestos; see when lead paint was banned and when asbestos was banned. Rewiring adds inspection steps to a schedule (kitchen remodel timeline), and contractor vetting is covered in how to choose a remodeling contractor.
Local benchmarks we calculated
Electrical warning-sign ratio by construction era (signature finding)
Formulashare of occupied homes built before 1940 reporting FUSEBLOW 1 to 4, NOWIRE = 2 or PLUGS = 2, divided by the same share for homes built 2000 or later; SE from 160 Fay replicate weights, variance = 0.025 x sum of squared deviations
Inputs: fact sheet AHS band rows for any of three items; derived_metrics d1 (fact sheet rows)
Result: 1.46 (SE 0.08): 14.9% of pre-1940 homes vs 10.2% of homes built 2000 or later, US, 2023
Occupants of knob-and-tube-era homes report electrical problems about one and a half times as often as occupants of homes built since 2000.
Limitations: Self-reported; no item identifies the wiring method; the fuse item also reflects household habits and new movers.
Item ratios, before 1940 vs 2000 or later
Formularatio of weighted shares for each AHS item, replicate SEs
Inputs: derived_metrics d3 to d6 (fact sheet rows)
Result: Exposed wiring 1.82 (SE 0.21); room without outlet 1.92 (SE 0.3); 3 or more blown fuses 1.81 (SE 0.24); any blown fuse 1.37 (SE 0.09)
The structural items (exposed wiring, missing outlets) separate the eras more than the behavioral fuse item.
Limitations: Small counts in the outlet item widen its interval.
Excess pre-1940 homes with a warning sign
Formula(14.87% minus 10.17%) / 100 x 16,247.1 thousand wired occupied pre-1940 homes
Inputs: derived_metrics d2 and d7; fact sheet pre-1940 home count (fact sheet rows)
Result: about 764,000 homes (SE about 117,000), US, 2023
The number of older homes reporting an electrical warning sign beyond the newer-home baseline.
Limitations: Assumes the 2000-or-later rate as a baseline; age, income and occupancy differences are not controlled.
Peak decade
Formulashare with any of three items, homes built in the 1930s / homes built in the 2000s
Inputs: tables/t2_by_decade_built.csv; derived_metrics d8 (fact sheet rows)
Result: 2.12 (18.4% vs 8.7%)
The decade closing the knob and tube era reports the most problems.
Limitations: No replicate SE for this ratio; 1,153 sample cases for the 1930s.
Concentration of pre-1940 homes
Formulasum of B25034_E011 for the five largest states / US B25034_E011
Inputs: tables/t3_states_pre1940.csv; derived_metrics d11 (fact sheet rows)
Result: 44.4% (7,430,081 of 16,741,814 homes), 2025
Knob-and-tube-era housing is concentrated in five states.
Limitations: Era indicator; rewired homes are included.
Insurer guideline coding, Maine filings
Formulaguidelines naming knob and tube / guidelines reviewed
Inputs: tables/t5_maine_guidelines.csv; derived_metrics d12 (fact sheet rows)
Result: 6 of 9 (66.7%): 4 bar any knob and tube, 2 bar active knob and tube only
Most of the filed homeowners guidelines found treat knob and tube as an eligibility issue.
Limitations: Nine documents from one state, editions 2018 to 2023; not a market-share-weighted measure.
Electrical job rate and cost by era
Formulashare of owner homes with an AHS job type 23 project, before 1940 / 2000 or later; weighted medians of JOBCOST
Inputs: tables/t6_electrical_jobs_by_era.csv; derived_metrics d9 and d10 (fact sheet rows)
Result: 2.01 times the job rate (9.9% vs 4.9%); median $1,500 vs $700 (ratio 2.14), 2022 to 2023
Older homes get electrical work more often and spend more on it.
Limitations: Job type includes lighting and panels; costs rounded and topcoded.
What the numbers show
- 16,741,814 US housing units were built 1939 or earlier, 11.3% of the 2025 housing stock (ACS 2025 1-year, B25034).[7]
- Adding the 6,154,761 homes built in the 1940s, 15.4% of US homes date from before 1950 (ACS 2025).[7]
- 14.9% of occupied US homes built before 1940 reported a blown fuse or tripped breaker in the last 3 months, exposed wiring, or a room without a working outlet in 2023, vs 10.2% of homes built 2000 or later (AHS 2023).[1]
- The pre-1940 to 2000-or-later ratio for those three items combined is 1.46, with a replicate-weight standard error of 0.08 (KBR calculation, AHS 2023).[1][5]
- 4.0% of pre-1940 homes reported exposed wiring in finished living areas in 2023, vs 2.2% of homes built 2000 or later, a ratio of 1.82 (AHS 2023).[1]
- 2.5% of pre-1940 homes had a room without a working electric wall outlet in 2023, vs 1.3% of homes built 2000 or later (AHS 2023).[1]
- Homes built in the 1930s had the highest rate of any decade in 2023: 18.4% reported at least one of the three electrical items (AHS 2023).[1]
- Across all 133,231 thousand occupied US homes, 10,429 thousand had a fuse blown or breaker tripped in the 3 months before the 2023 interview (AHS 2023, matching the Census published PUF estimate).[1][2]
- New York (2,634,166), Pennsylvania (1,381,651), California (1,284,468), Illinois (1,117,920) and Ohio (1,011,876) hold 44.4% of all US homes built 1939 or earlier (ACS 2025).[7]
- The District of Columbia (31.9%), New York (30.1%) and Massachusetts (30.0%) have the highest shares of homes built 1939 or earlier; Nevada (1.2%) has the lowest (ACS 2025).[7]
- State Farm's Maine homeowners guidelines effective January 1, 2023 list a dwelling with knob and tube wiring as unacceptable.[17]
- Farmers' Maine guidelines dated October 5, 2021 and December 9, 2022 bar homes with active knob and tube wiring.[18][19]
- Citizens Property Insurance Corporation's sample 4-Point Inspection Form (Insp4pt 01 18) asks Florida inspectors to mark active knob and tube wiring, and Citizens says underwriting uses the form to determine insurability.[16]
- US fire departments responded to an estimated 23,700 residential building electrical malfunction fires in 2023, with 305 deaths; the federal data do not identify wiring type (USFA).[10]
- 9.9% of owner-occupied pre-1940 homes had an electrical wiring, panel or built-in lighting job in the 2 years before the 2023 survey, vs 4.9% of homes built 2000 or later (AHS 2023).[1]
Questions people ask
Is knob and tube wiring dangerous?
No US dataset measures its fire rate: the 23,700 residential electrical malfunction fires in 2023 (USFA) are not split by wiring type. Regulators name the risk factors as age, brittle insulation, oversized fuses, added outlets and insulation packed around the wires (ESA Ontario, CEE). In AHS 2023, pre-1940 homes reported exposed wiring at 4.0% vs 2.2% for homes built 2000 or later. This is not electrical advice.
Can you get homeowners insurance with knob and tube wiring?
It depends on the insurer. Six of nine homeowners guidelines filed in Maine list knob and tube as ineligible or unacceptable, two of them only when it is active; three do not name it. Florida's Citizens asks 4-Point inspectors to report active knob and tube. This is not insurance advice.
How much does it cost to replace knob and tube wiring?
No public dataset reports a knob and tube replacement price. The closest sourced figure is the AHS 2023 median of $1,500 that owners of pre-1940 homes reported for electrical wiring, panel or lighting jobs, which includes small jobs. Online ranges such as $3,500 to $8,000 carry no source and are not used here.
Do I have to replace knob and tube wiring when remodeling?
No national rule found here requires removing existing knob and tube that is left alone. Menlo Park, California recommends removing what is found during construction to the maximum extent practical, and Berkeley (permits and inspections) and Washington (inspection) regulate repairs, alterations and extensions. Ask the local building department.
How do I tell if my house has knob and tube wiring?
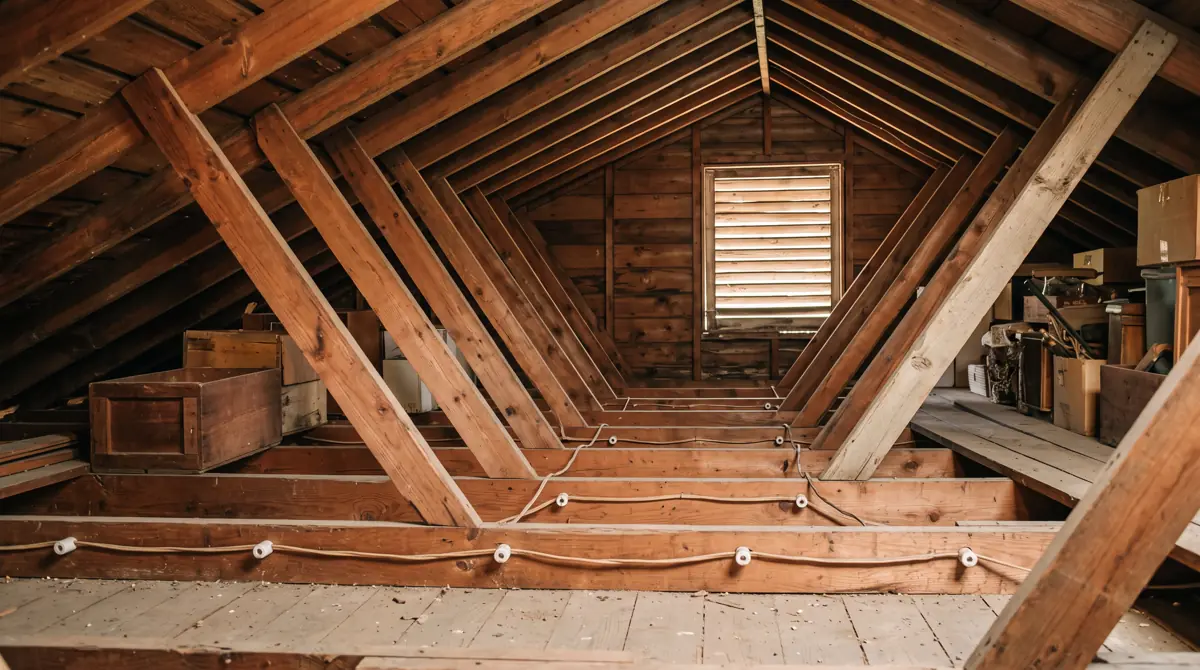
Look in unfinished attics and basements for single wires on porcelain knobs and through porcelain tubes in the framing, often with a cloth or rubber coating (Menlo Park, CEE). A house built before 1940 is in the era; 16.7 million US homes were (ACS 2025). An electrician can confirm whether it is still active.
Frequently asked questions
When was knob and tube wiring used?
Tacoma Power dates it to homes built between 1880 and 1950; Menlo Park says it was used until the 1940s, and Ontario's ESA says the early 1900s to 1940s.
How many US homes were built before 1940?
16,741,814 housing units, 11.3% of the US stock, according to ACS 2025 1-year table B25034, released October 29, 2026.
How many homes still have knob and tube wiring?
Nobody knows. No federal survey asks about wiring method; the 16.7 million pre-1940 homes are an upper bound for the era, and many have been rewired.
Do older homes report more electrical problems?
Yes. In AHS 2023, 14.9% of homes built before 1940 reported a blown fuse, exposed wiring or a room without a working outlet, vs 10.2% of homes built 2000 or later.
Which decade's homes report the most electrical problems?
Homes built in the 1930s: 18.4% reported at least one of the three AHS electrical items in 2023, vs 8.7% for homes built in the 2000s.
Which states have the most pre-1940 homes?
By count, New York (2,634,166), Pennsylvania and California; by share, the District of Columbia (31.9%), New York (30.1%) and Massachusetts (30.0%), per ACS 2025.
Does State Farm insure homes with knob and tube wiring?
Its Maine homeowners guidelines effective January 1, 2023 list a dwelling with knob and tube wiring as unacceptable. Rules in other states were not reviewed.
Can you put insulation over knob and tube wiring?
California's code bars it in hollow spaces filled with loose, rolled or foamed-in-place insulation unless an electrician certifies the wiring; Washington sets three conditions, including no foam.
How common are blown fuses and tripped breakers?
In 2023, 10,429 thousand of 133,231 thousand occupied US homes, or 7.8%, had a fuse blow or breaker trip in the 3 months before the AHS interview.
How often do owners of pre-1940 homes do electrical work?
9.9% had an electrical wiring, panel or built-in lighting job in the 2 years before the 2023 AHS, vs 4.9% of owners of homes built 2000 or later.
For journalists and researchers
If you cite only a few, cite these
- Ratio of 1.46 (SE 0.08) for electrical warning signs, homes built before 1940 vs 2000 or later, US, 2023 (KBR analysis of AHS 2023 PUF v1.1).[1][5]
- 16.7 million US homes built 1939 or earlier, 2025 (ACS 2025 1-year, B25034).[7]
- 6 of 9 Maine-filed insurer guidelines name knob and tube wiring (State Farm 2023, Hannover 2018, Integon 2019 and 2020, Farmers 2021 and 2022).[17][18][19][20][21][22]
Most quotable statistics
- 14.9% of US homes built before 1940 reported a blown fuse, exposed wiring or a room without a working outlet in 2023, vs 10.2% of homes built 2000 or later (KBR analysis of AHS 2023).[1]
- Pre-1940 homes reported exposed wiring 1.82 times as often as homes built 2000 or later in 2023: 4.0% vs 2.2% (AHS 2023).[1]
- 16,741,814 US homes were built 1939 or earlier, 11.3% of the 2025 housing stock (ACS 2025).[7]
- Five states, New York, Pennsylvania, California, Illinois and Ohio, hold 44.4% of US homes built before 1940 (ACS 2025).[7]
- Six of nine homeowners underwriting guidelines filed in Maine list knob and tube wiring as ineligible or unacceptable (editions 2018 to 2023).[17][20][21]
- Homes built in the 1930s report electrical warning signs at 18.4%, the highest of any decade (AHS 2023).[1]
Press summary
A Kitchen and Bath Renovators analysis of the federal American Housing Survey finds that homes built before 1940, the era of knob and tube wiring, report electrical warning signs about one and a half times as often as homes built since 2000. In 2023, 14.9% of occupied pre-1940 homes reported a blown fuse or tripped breaker, exposed wiring or a room without a working outlet, compared with 10.2% of homes built 2000 or later, a ratio of 1.46. Exposed wiring alone was reported in 4.0% of pre-1940 homes vs 2.2% of newer ones. Census data released October 29, 2026 count 16.7 million US homes built 1939 or earlier, 44.4% of them in five states. No survey counts the wiring itself. A review of nine homeowners underwriting guidelines filed in Maine found six that list knob and tube wiring as ineligible or unacceptable. Data and code are published under CC BY 4.0.
Suggested headlines
- Pre-1940 homes report electrical problems 1.46 times as often as new ones, federal survey shows
- 16.7 million US homes date from the knob and tube era
- Exposed wiring: 4.0% of pre-1940 homes vs 2.2% of homes built since 2000
- Six of nine insurer guidelines filed in Maine list knob and tube wiring as ineligible
- 1930s homes report the most electrical warning signs of any decade: 18.4%
How to cite this report
Kitchen and Bath Renovators. (2026). Knob and Tube Wiring: How Many Homes Date From the Era, and What Insurers Do. Retrieved from https://kitchenandbathrenovators.com/research/knob-and-tube-wiring/
Reuse license
Data and tables are licensed CC BY 4.0. Attribution: “Source: Kitchen and Bath Renovators, Knob and Tube Wiring: How Many Homes Date From the Era, and What Insurers Do” with a link to this page.
Download the data
Every table in this report is available as a CSV under CC BY 4.0. The fact sheet lists each value with its source URL and access date.
- derived_metrics.csv (CSV)
- fact_sheet.csv (CSV)
- Insurer, insurance regulator and code statements on knob and tube wiring, dated (CSV)
- t1_warning_signs_by_era.csv (CSV)
- t2_by_decade_built.csv (CSV)
- t3_states_pre1940.csv (CSV)
- t4_timeline.csv (CSV)
- t5_maine_guidelines.csv (CSV)
- t6_electrical_jobs_by_era.csv (CSV)
Reproduce this analysis
Every figure comes from the files below. The scripts that pulled and computed them are kept with the report and can be re-run.
| Dataset | Publisher | Source | Query or filter | Rows used | Retrieved |
|---|---|---|---|---|---|
| American Housing Survey 2023 national PUF v1.1, household and project files | U.S. Census Bureau and HUD | File or endpoint | household.csv: INTSTATUS = '1'; YRBUILT bands; FUSEBLOW, NOWIRE, PLUGS, TENURE; WEIGHT and REPWEIGHT1 to REPWEIGHT160. project.csv: JOBTYPE = '23', JOBDIY in 1 or 2, JOBCOST > 0 | 48,527 occupied household rows of 55,669; 2,097 electrical job rows of 44,689 project rows (1,995 owner-occupied with cost) | 2026-11-02 |
| AHS 2023 Table Specifications and PUF Estimates for User Verification | U.S. Census Bureau | File or endpoint | Sheet Housing Quality, rows for exposed wiring, rooms without electric outlets, fuses or breakers blown | 7 rows used for verification | 2026-11-02 |
| ACS 2025 1-year table-based summary file, B25034 | U.S. Census Bureau | File or endpoint | GEO_ID 0100000US and 0400000US01 to 0400000US56; B25034_E001, E010, E011 and MOEs; labels checked in ACS20251YR_Table_Shells.txt | 52 rows (US, 50 states, DC) | 2026-11-02 |
| Maine homeowners underwriting guidelines (9 insurer files), Internet Archive captures of maine.gov | Maine Bureau of Insurance via Internet Archive | File or endpoint | Full text searched for knob, wiring and electrical; one coding per file (other 8 file URLs in sources s18 to s25) | 9 documents | 2026-11-02 |
Data quality and exclusions
- Removed 7,142 household rows that are not occupied interviews (vacant or usual residence elsewhere), leaving 48,527 occupied rows.
- Fuse items exclude occupied homes with no electrical wiring (NOWIRE = 3, 121 thousand weighted), as in the Census table; the combined item uses the same base.
- FUSEBLOW = N (not applicable) and PLUGS = N are counted as no; no imputation was added.
- Project file: kept 2,097 job type 23 rows with JOBDIY 1 or 2; 1,995 owner-occupied jobs with a reported cost above zero went into the medians.
- ACS: kept the US row and 51 state and DC rows of the B25034 file; Puerto Rico and substate rows were dropped.
- Maine guidelines: maine.gov refused automated requests (access denied), so 9 files were read from Internet Archive captures; GuideOne's knob and tube PDF was no longer online and was dropped.
Methodology
Source selection: the American Housing Survey 2023 national PUF v1.1 (released January 22, 2025, the latest national file) for electrical deficiency items and home improvement jobs; ACS 2025 1-year table B25034 from the Census table-based summary file (released October 29, 2026) for homes by year built; the USFA fire trends page; state and city code documents; insurer guidelines posted by the Maine Bureau of Insurance; and the Citizens 4-Point form. Tier 3 journalism is used only for dated statements.
AHS estimates: occupied units (INTSTATUS = 1), weighted by WEIGHT. Items: FUSEBLOW (1 to 4 = at least one blown fuse or tripped breaker in 3 months; 3 and 4 = three or more), NOWIRE = 2 (exposed wiring), PLUGS = 2 (a room without a working wall outlet). Fuse shares use homes with wiring (NOWIRE 1 or 2) as the base, matching Census table C-05-AO. Year-built bands come from YRBUILT. Standard errors use the 160 replicate weights with variance = 4/160 x sum of squared deviations, per the Census quick guide.
Verification: the recomputed national totals match the Census published PUF estimates exactly: 133,231 thousand occupied homes, 3,721 thousand with exposed wiring, 2,247 thousand with a room lacking outlets and 10,429 thousand with a blown fuse or tripped breaker (verification_log.md).
Home improvement jobs: AHS project file, JOBTYPE 23 (electrical wiring, fuse boxes, breaker panels or built-in lighting), linked to owner-occupied households by CONTROL; medians are weighted by the household weight and use jobs with JOBCOST above zero.
Insurer registry: the nine Maine guideline PDFs were found on maine.gov, which blocked automated downloads, so each was read from an Internet Archive capture of the official file and labelled as such. Each was coded as bars any knob and tube, bars active knob and tube only, general wiring rule, or not named. Conflicting dates for when knob and tube left use (1940s vs 1950) are shown side by side.
Data last updated November 2, 2026. Next scheduled updates: the AHS 2025 national PUF and ACS 2026 1-year estimates.
This report presents published data with its limitations. It is not legal, financial or investment advice.
Sources, ranked by quality
Tier 1: primary and official sources (27)
- [1] U.S. Census Bureau and HUD. American Housing Survey 2023 National Public Use File v1.1 (CSV). 2023 survey; PUF v1.1 released January 22, 2025. Accessed 2026-11-02.
- [2] U.S. Census Bureau. AHS 2023 Table Specifications and PUF Estimates for User Verification. 2023. Accessed 2026-11-02.
- [3] U.S. Census Bureau. American Housing Survey for the United States: 2023, Definitions. 2023. Accessed 2026-11-02.
- [4] U.S. Census Bureau. AHS 2023 Value Labels Package. 2023. Accessed 2026-11-02.
- [5] U.S. Census Bureau. Quick Guide to Estimating Variance Using Replicate Weights: 2009 to Current. 2009 to current. Accessed 2026-11-02.
- [6] U.S. Census Bureau. 2023 AHS National PUF Versioning Document. v1.0 September 25, 2024; v1.1 January 22, 2025. Accessed 2026-11-02.
- [7] U.S. Census Bureau. American Community Survey 2025 1-year, Table B25034 Year Structure Built (table-based summary file). 2025 (released October 29, 2026). Accessed 2026-11-02.
- [8] U.S. Census Bureau. ACS 2025 1-year Table Shells (B25034 line labels). 2025. Accessed 2026-11-02.
- [9] U.S. Census Bureau. 2025 ACS Data Release Schedule. Updated October 29, 2026. Accessed 2026-11-02.
- [10] U.S. Fire Administration (FEMA). Residential Building Electrical Malfunction Fire Trends (2014-2023). 2014 to 2023. Accessed 2026-11-02.
- [11] Washington State Legislature (Department of Labor and Industries rule). WAC 296-46B-394 Concealed knob-and-tube wiring (certified 3/13/2024). Effective April 1, 2024. Accessed 2026-11-02.
- [12] City of Berkeley Building and Safety. Form 146: Knob-and-Tube Wiring Safety Report (last revised 03/25/26). 2025 California Electrical Code. Accessed 2026-11-02.
- [13] City of Menlo Park Building Division. Knob and Tube Safety Wiring Requirements. 2025 California codes. Accessed 2026-11-02.
- [14] City of Menlo Park Community Development. Knob and Tube Safety Requirements for Attics (form). 2025 California Electrical Code. Accessed 2026-11-02.
- [15] Tacoma Power (City of Tacoma). Knob & Tube Wiring Inspection Requirements, Form 3504 (rev. 2/2018). Form revised February 2018. Accessed 2026-11-02.
- [16] Citizens Property Insurance Corporation (Florida). 4-Point Inspection Form, Sample Form Insp4pt 01 18. Form edition 01 18. Accessed 2026-11-02.
- [17] State Farm via Maine Bureau of Insurance (Internet Archive capture 2024-05-20). State Farm Underwriting Guidelines, Homeowners, Maine (effective 1/1/2023), filed with the Maine Bureau of Insurance; Internet Archive capture of the maine.gov file. Effective January 1, 2023. Accessed 2026-11-02.
- [18] Farmers via Maine Bureau of Insurance (Internet Archive capture 2024-05-17). Farmers Property and Casualty Insurance Company, Maine Homeowner New Business Underwriting Guidelines (October 5, 2021); Internet Archive capture of the maine.gov file. October 5, 2021. Accessed 2026-11-02.
- [19] Farmers via Maine Bureau of Insurance (Internet Archive capture 2024-05-18). Farmers Casualty Insurance Company (FCAS), Maine Homeowner Underwriting Guidelines (December 9, 2022); Internet Archive capture of the maine.gov file. December 9, 2022. Accessed 2026-11-02.
- [20] Hanover Insurance Group via Maine Bureau of Insurance (Internet Archive capture 2024-07-19). Hannover, Maine Homeowners Underwriting Guidelines (effective 12/03/2018); Internet Archive capture of the maine.gov file. Effective December 3, 2018. Accessed 2026-11-02.
- [21] Integon National via Maine Bureau of Insurance (Internet Archive capture 2024-05-18). Integon National Insurance Company, Maine Homeowners OneChoice (revised April 25, 2019); Internet Archive capture of the maine.gov file. Revised April 25, 2019. Accessed 2026-11-02.
- [22] Integon National via Maine Bureau of Insurance (Internet Archive capture 2024-05-17). Integon National Insurance Company, Homeowners Guidelines OneChoice and Premier Client, Maine (undated; file created October 12, 2020); Internet Archive capture of the maine.gov file. Undated (PDF created 2020-10-12). Accessed 2026-11-02.
- [23] USAA via Maine Bureau of Insurance (Internet Archive capture 2024-05-20). USAA Group Homeowners Insurance Underwriting Guidelines, Maine (Rev. Eff. 02/24/2023); Internet Archive capture of the maine.gov file. Effective February 24, 2023. Accessed 2026-11-02.
- [24] Chubb via Maine Bureau of Insurance (Internet Archive capture 2024-07-19). Homeowners Underwriting Guidelines, State: Maine (effective 08/01/2022), Chubb writing companies; Internet Archive capture of the maine.gov file. Effective August 1, 2022. Accessed 2026-11-02.
- [25] Unnamed insurer via Maine Bureau of Insurance (Internet Archive capture 2024-05-17). Maine Homeowners New Business Eligibility and Pricing Guidelines, form PL-12430 (01-07), insurer not named on the form; Internet Archive capture of the maine.gov file. Form edition 01-07. Accessed 2026-11-02.
- [26] Electrical Safety Authority (Ontario, Canada). Flash 25-05-FL: Knob and tube wiring in residential installations (May 2025). May 2025. Accessed 2026-11-02.
- [27] Electrical Safety Authority (Ontario, Canada). Flash 22-16-FL: Knob and tube wiring in residential installations (May 2022). May 2022. Accessed 2026-11-02.
Tier 2: trade bodies, market research, company data (1)
- [28] Center for Energy and Environment (Minnesota nonprofit). Dealing with knob-and-tube wiring (February 5, 2025). 2025. Accessed 2026-11-02.
Tier 3: journalism and expert commentary (5)
- [29] ABC7 News (KGO-TV). Bay Area homeowners could get coverage denied or canceled for having outdated knob and tube electrical system (March 13, 2025). 2025. Accessed 2026-11-02.
- [30] The Seattle Times. Condition of knob and tube wiring is key to getting older home insured (January 25, 2003). 2003. Accessed 2026-11-02.
- [31] Fire Engineering. Construction Concerns: Knob and Tube Wiring (November 13, 2008). 2008. Accessed 2026-11-02.
- [32] Waypoint Property Inspection. Knob and Tube Wiring (February 24, 2021). 2021. Accessed 2026-11-02.
- [33] Mr. Electric. What is Knob and Tube Wiring?. Undated. Accessed 2026-11-02.