Radon Map: Test Results by State vs EPA's 1993 Zones
- Primary data
- CDC Environmental Public Health Tracking Network, radon tests from labs (measure 866) and from state programs (measure 743)
- Data period
- Lab tests 2008 to 2017 (latest 10-year window); state-program tests 2014 to 2023 (2023 is the latest year)
- Latest release used
- 2026-11-02 (date retrieved; the API does not date the radon release)
- Next release
- Not announced; the lab series has not advanced past 2017
- Geography
- 50 states and DC (lab data for 46 states and DC; state-program data for 22 states)
- Sources
- 28 (25 Tier 1)
North Dakota, Nebraska, South Dakota and Iowa top this radon map: 58.5 to 59.3 percent of their 2008 to 2017 lab tests read 4 pCi/L or higher, against 35.7 percent nationally (CDC). EPA's 1993 zones rank counties correctly, yet 15.3 percent of Zone 3 tests reached 4. Sixteen states require a radon-specific notice at sale.
North Dakota, Nebraska, South Dakota and Iowa top the radon map at 58.5 percent or more of tests high
In CDC's lab data for 2008 to 2017, North Dakota leads at 59.3 percent of tests at or above 4 pCi/L, and Nebraska, South Dakota and Iowa sit at 58.5 percent. The 47-jurisdiction figure is 35.7 percent.
pCi/L: Picocuries per liter of air, the US unit for radon. EPA recommends fixing a home at 4 pCi/L (150 Bq/m3) or more and considering a fix between 2 and 4.
CDC's Environmental Public Health Tracking Network collects radon test counts from laboratories and splits them into three bands: under 2 pCi/L, 2 to under 4, and 4 or higher. KBR pulled every county row from the Tracking Network API for the latest 10-year lab window, 2008 to 2017, and summed the counts to states. That gives 2,013,544 pre-mitigation tests, 718,943 of them at or above 4 pCi/L.
Pre-mitigation tests reported to CDC by laboratories; blank tiles have no lab data
Source: CDC Environmental Public Health Tracking Network, radon tests from labs (measure 866); KBR state totals.
The top ten run from North Dakota (59.3 percent) through Ohio (52.3 percent), Colorado (47.0 percent), Wisconsin (46.9 percent), Montana (45.5 percent), Wyoming (44.3 percent) and Kentucky (43.7 percent). The Gulf Coast sits at the bottom: Louisiana 2.2 percent, Texas 10.2 percent. Massachusetts sent the most tests, 234,152, with 23.8 percent high.
Show all 51 rows
| State | Lab tests 2008 to 2017 | % at or above 4 pCi/L | Rank of 47 | Zone 1 counties | Zone 2 counties | Zone 3 counties | % of residents in Zone 1 | Seller radon rule |
|---|---|---|---|---|---|---|---|---|
| Alabama | 12,569 | 21.9 | 37 | 13 | 33 | 21 | 23.1 | None found |
| Alaska | 830 | 18.2 | 40 | 0 | 5 | 22 | 0.0 | On general seller form |
| Arizona | 3,589 | 16.8 | 41 | 0 | 15 | 0 | 0.0 | None found |
| Arkansas | 668 | 23.2 | 33 | 0 | 14 | 61 | 0.0 | None found |
| California | 9,415 | 10.3 | 44 | 2 | 29 | 27 | 3.2 | On general seller form |
| Colorado | 96,367 | 47.0 | 6 | 53 | 11 | 0 | 97.6 | Radon notice or test results |
| Connecticut | 25,572 | 26.5 | 25 | 4 | 3 | 1 | 62.6 | On general seller form |
| Delaware | 12,214 | 16.7 | 42 | 0 | 1 | 2 | 0.0 | Radon notice or test results |
| District of Columbia | 2,126 | 8.7 | 46 | 0 | 0 | 1 | 0.0 | On general seller form |
| Florida | 53,794 | 22.7 | 35 | 0 | 9 | 58 | 0.0 | Radon notice or test results |
| Georgia | 30,152 | 24.8 | 28 | 4 | 55 | 100 | 32.6 | None found |
| Hawaii | no lab data | 0 | 0 | 5 | 0.0 | None found | ||
| Idaho | 12,961 | 41.5 | 15 | 19 | 20 | 5 | 23.6 | None found |
| Illinois | 108,909 | 43.1 | 12 | 56 | 43 | 3 | 26.9 | Radon notice or test results |
| Indiana | 43,148 | 38.9 | 16 | 57 | 35 | 0 | 71.8 | On general seller form |
| Iowa | 95,245 | 58.5 | 4 | 99 | 0 | 0 | 100.0 | Radon notice or test results |
| Kansas | no lab data | 65 | 40 | 0 | 55.1 | Radon notice or test results | ||
| Kentucky | 28,793 | 43.7 | 10 | 30 | 82 | 8 | 45.2 | Radon notice or test results |
| Louisiana | 499 | 2.2 | 47 | 0 | 0 | 64 | 0.0 | On general seller form |
| Maine | 11,825 | 37.6 | 17 | 12 | 4 | 0 | 89.3 | On general seller form |
| Maryland | 47,941 | 23.9 | 30 | 8 | 9 | 7 | 52.0 | On general seller form |
| Massachusetts | 234,152 | 23.8 | 31 | 3 | 10 | 1 | 47.3 | None found |
| Michigan | 114,407 | 26.9 | 24 | 9 | 32 | 42 | 12.1 | On general seller form |
| Minnesota | 130,912 | 43.4 | 11 | 68 | 19 | 0 | 81.0 | Radon notice or test results |
| Mississippi | no lab data | 0 | 8 | 74 | 0.0 | None found | ||
| Missouri | 58,525 | 30.6 | 21 | 11 | 97 | 7 | 22.2 | None found |
| Montana | 9,893 | 45.5 | 8 | 50 | 7 | 0 | 83.7 | Radon notice or test results |
| Nebraska | 42,782 | 58.5 | 2 | 53 | 24 | 16 | 83.3 | Radon notice or test results |
| Nevada | 10,930 | 22.8 | 34 | 9 | 7 | 1 | 6.3 | None found |
| New Hampshire | 15,608 | 35.0 | 19 | 1 | 9 | 0 | 3.7 | Radon notice or test results |
| New Jersey | no lab data | 7 | 11 | 3 | 24.3 | Radon notice or test results | ||
| New Mexico | 3,721 | 28.5 | 23 | 7 | 26 | 0 | 44.3 | None found |
| New York | 97,145 | 24.5 | 29 | 34 | 13 | 15 | 23.1 | Radon notice or test results |
| North Carolina | 73,139 | 22.6 | 36 | 8 | 31 | 61 | 5.7 | On general seller form |
| North Dakota | 6,607 | 59.3 | 1 | 53 | 0 | 0 | 100.0 | Radon notice or test results |
| Ohio | 98,840 | 52.3 | 5 | 53 | 35 | 0 | 63.0 | On general seller form |
| Oklahoma | 814 | 12.7 | 43 | 0 | 9 | 68 | 0.0 | On general seller form |
| Oregon | 23,951 | 25.4 | 27 | 0 | 21 | 15 | 0.0 | On general seller form |
| Pennsylvania | 203,045 | 41.7 | 14 | 49 | 17 | 1 | 77.3 | On general seller form |
| Rhode Island | 37,874 | 23.8 | 32 | 2 | 2 | 1 | 27.2 | Radon notice or test results |
| South Carolina | 26,481 | 19.4 | 39 | 1 | 8 | 37 | 10.5 | On general seller form |
| South Dakota | 6,275 | 58.5 | 3 | 48 | 18 | 0 | 72.6 | On general seller form |
| Tennessee | 31,066 | 33.3 | 20 | 39 | 32 | 24 | 52.0 | On general seller form |
| Texas | 4,615 | 10.2 | 45 | 0 | 39 | 215 | 0.0 | On general seller form |
| Utah | 28,342 | 41.9 | 13 | 7 | 22 | 0 | 4.1 | None found |
| Vermont | 10,600 | 21.7 | 38 | 0 | 12 | 2 | 0.0 | None found |
| Virginia | 53,199 | 30.4 | 22 | 64 | 28 | 44 | 42.8 | Radon notice or test results |
| Washington | 8,201 | 25.5 | 26 | 7 | 14 | 18 | 15.2 | On general seller form |
| West Virginia | 10,061 | 37.5 | 18 | 20 | 29 | 6 | 39.5 | None found |
| Wisconsin | 68,104 | 46.9 | 7 | 28 | 44 | 0 | 42.0 | On general seller form |
| Wyoming | 7,638 | 44.3 | 9 | 21 | 2 | 0 | 97.4 | None found |
Tests are pre-mitigation results reported by labs to CDC's Tracking Network, summed across counties. Residents: Census Vintage 2025 (Connecticut legacy counties: Vintage 2021). Seller rule from the KBR registry of ELI's 2026 database.
Source: [1][4][5][6][20] CDC National Environmental Public Health Tracking Network; U.S. Environmental Protection Agency; U.S. Census Bureau; U.S. Census Bureau; Environmental Law Institute
EPA's 1993 zones sort counties in the right order, but 15.3 percent of Zone 3 tests still hit 4
Matching 2,013,541 county-level lab tests to EPA zones, the share of high results falls from 42.4 percent in Zone 1 to 15.3 percent in Zone 3. The map works as a ranking and fails as an all-clear.
The EPA Map of Radon Zones was built in 1993 from indoor measurements, geology, aerial radioactivity, soils and foundation types. Its legend describes Zone 1 as counties where average indoor levels may be greater than 4 pCi/L, Zone 2 as between 2 and 4, and Zone 3 as under 2. EPA says the map should not be used to decide whether a home needs testing. Its current county list sorts 3,144 counties into 1,074 in Zone 1, 1,034 in Zone 2 and 1,036 in Zone 3.
County lab tests 2008 to 2017 matched to EPA's 1993 zones
Source: CDC Tracking Network (measure 866); EPA Map of Radon Zones; Census Vintage 2025; KBR county join.
High results in Zone 1 counties were 2.8 times as common as in Zone 3. But 26,315 tests from Zone 3 counties read 4 pCi/L or higher. Among the 158 Zone 3 counties with at least 100 tests, the median county share was 9.6 percent, and 19 counties reached 25 percent or more. The reverse miss is rare: 5 of 676 Zone 1 counties with 100 or more tests came in under 15 percent.
| EPA zone | Counties with tests | Tests | Tests at or above 4 | % at or above 4 | % of all tests | Residents 2025 | % of residents | Tests per 1,000 residents |
|---|---|---|---|---|---|---|---|---|
| Zone 1 (predicted above 4 pCi/L) | 993 | 1,217,840 | 516,700 | 42.4 | 60.5 | 85,577,077 | 26.3 | 14.23 |
| Zone 2 (predicted 2 to 4) | 940 | 623,506 | 175,928 | 28.2 | 31.0 | 113,125,635 | 34.8 | 5.51 |
| Zone 3 (predicted under 2) | 727 | 172,195 | 26,315 | 15.3 | 8.6 | 126,086,831 | 38.8 | 1.37 |
47 jurisdictions with lab data. Residents restricted to the same 47 jurisdictions. Ten years of tests divided by a single 2025 population.
Source: [1][4][5][6] CDC National Environmental Public Health Tracking Network; U.S. Environmental Protection Agency; U.S. Census Bureau; U.S. Census Bureau
Testing tracks the map. Zone 1 counties produced 60.5 percent of all lab tests with 26.3 percent of residents: 14.23 tests per 1,000 people over ten years, against 1.37 in Zone 3. Fewer tests in low zones means fewer high results get found there, which is one reason the low zones look quiet.
| County | State | Lab tests 2008 to 2017 | Tests at or above 4 | % at or above 4 |
|---|---|---|---|---|
| King George | Virginia | 488 | 222 | 45.5 |
| Holt | Nebraska | 349 | 149 | 42.7 |
| Herkimer | New York | 337 | 140 | 41.5 |
| Maury | Tennessee | 509 | 200 | 39.3 |
| Tuscola | Michigan | 369 | 131 | 35.5 |
| Caroline | Virginia | 199 | 65 | 32.7 |
| Richmond City | Virginia | 520 | 144 | 27.7 |
| Lincoln | Nebraska | 895 | 242 | 27.0 |
| Henrico | Virginia | 607 | 164 | 27.0 |
| Huron | Michigan | 260 | 69 | 26.5 |
| Fredericksburg | Virginia | 375 | 98 | 26.1 |
| Marion | Oregon | 1,394 | 363 | 26.0 |
| Collier | Florida | 20,308 | 5,260 | 25.9 |
| Franklin | Tennessee | 266 | 68 | 25.6 |
| Davidson | North Carolina | 1,265 | 323 | 25.5 |
| Charlotte | Florida | 162 | 41 | 25.3 |
| Stanly | North Carolina | 229 | 58 | 25.3 |
| Polk | Oregon | 575 | 145 | 25.2 |
| Lee | Florida | 11,873 | 2,983 | 25.1 |
Zone 3 is EPA's lowest predicted radon category. Counties with fewer than 100 tests excluded.
Source: [1][4] CDC National Environmental Public Health Tracking Network; U.S. Environmental Protection Agency
Seven states with almost no Zone 1 residents test like high-radon states
Utah, New Hampshire, Oregon, Nevada, Florida, North Carolina and Vermont each have under 10 percent of residents in Zone 1, yet 26.3 percent of their 216,364 lab tests read 4 pCi/L or higher.
Set each state's share of high tests beside the share of its people the 1993 map placed in Zone 1, and two groups stand out. Utah (41.9 percent of tests high, 4.1 percent of residents in Zone 1) and New Hampshire (35.0 percent, 3.7 percent) sit above or just below the 47-jurisdiction figure of 35.7 percent. Oregon, Florida and Vermont have no Zone 1 county at all and still return more than 20 percent high results.
Share of lab tests at or above 4 pCi/L vs share of residents in Zone 1
Source: CDC Tracking Network (measure 866); EPA Map of Radon Zones; Census Vintage 2025 (CT: Vintage 2021).
The opposite pattern appears in Connecticut and Maryland. Connecticut places 62.6 percent of residents in Zone 1 but only 26.5 percent of its lab tests were high. Connecticut's own program data tell a different story: 44.9 percent of 31,488 state-reported tests from 2014 to 2019 were at or above 4. Two sources, two answers, which is why this report treats single-state gaps as leads, not verdicts.
Florida shows how a county can beat its zone. Collier County, in Zone 3, logged 20,308 lab tests with 25.9 percent at or above 4 pCi/L; Lee County logged 11,873 with 25.1 percent.
State programs' newer counts run through 2023, and 7 of 9 steady reporters came in lower
22 states sent annual test counts to CDC for at least one year from 2014 to 2023: 3,891,265 tests, 30.1 percent at or above 4 pCi/L. Only 11 reported 2023.
The second CDC series comes from state radon programs rather than labs, one year at a time. It is newer but thinner: 11 states reported 2023 (128,740 tests, 33.4 percent high), and the mix of states changes almost every year, so a yearly national line would mostly track who reported. KBR therefore compares each state with itself.
States reporting at least five of the ten years
Source: CDC Tracking Network, radon tests from states (measure 743); KBR pooled totals.
Nine states reported every year from 2014 to 2023. In 7 of them (Colorado, Florida, Minnesota, Nebraska, Oregon, Utah, Vermont) the 2019 to 2023 share is below the state's 2008 to 2017 lab share. Nebraska moved from 58.5 percent in lab data to 40.3 percent in 2019 to 2023 program data. The two series come from different collectors, so the gap is a prompt for state-level checks, not proof that homes got safer.
Two outliers look like definition differences: New Jersey reported 950,679 tests with 11.4 percent high, and Rhode Island 1,756 tests with 2.3 percent high against 23.8 percent in Rhode Island's lab data.
| State | Years in file | Years reported | Tests | % at or above 4 pCi/L | % 2019 to 2023 | Tests 2023 | % 2023 | Lab % 2008 to 2017 |
|---|---|---|---|---|---|---|---|---|
| Nebraska | 2014 to 2023 | 10 | 471,813 | 45.8 | 40.3 | 11,163 | 38.2 | 58.5 |
| Connecticut | 2014 to 2019 | 6 | 31,488 | 44.9 | 35.1 | 26.5 | ||
| Colorado | 2014 to 2023 | 10 | 212,529 | 42.7 | 42.3 | 21,802 | 38.9 | 47.0 |
| Wisconsin | 2014 to 2023 | 9 | 149,989 | 42.2 | 36.9 | 20,879 | 35.7 | 46.9 |
| New Hampshire | 2018 to 2021 | 4 | 9,698 | 39.5 | 41.1 | 35.0 | ||
| Utah | 2014 to 2023 | 10 | 109,296 | 37.7 | 36.9 | 27,422 | 36.1 | 41.9 |
| Minnesota | 2014 to 2023 | 10 | 289,734 | 37.4 | 33.2 | 22,449 | 34.6 | 43.4 |
| Illinois | 2014 to 2017 | 4 | 430,800 | 35.9 | 43.1 | |||
| Missouri | 2014 to 2023 | 10 | 21,360 | 33.9 | 35.9 | 1,412 | 35.7 | 30.6 |
| Kansas | 2016 to 2022 | 7 | 199,762 | 33.6 | 32.1 | |||
| Pennsylvania | 2014 to 2020 | 7 | 659,073 | 33.6 | 30.9 | 41.7 | ||
| Tennessee | 2022 to 2023 | 2 | 11,984 | 24.0 | 24.0 | 2,378 | 24.9 | 33.3 |
| New York | 2014 to 2023 | 10 | 26,965 | 23.8 | 25.6 | 1,017 | 32.0 | 24.5 |
| Florida | 2014 to 2023 | 10 | 176,057 | 22.7 | 22.0 | 16,589 | 18.5 | 22.7 |
| Oregon | 2014 to 2023 | 10 | 47,388 | 20.9 | 18.4 | 2,329 | 18.9 | 25.4 |
| North Carolina | 2014 to 2022 | 4 | 29,948 | 19.8 | 18.6 | 22.6 | ||
| Alaska | 2014 to 2022 | 9 | 1,791 | 17.9 | 15.3 | 18.2 | ||
| Washington | 2014 to 2020 | 7 | 26,017 | 17.8 | 20.1 | 25.5 | ||
| Vermont | 2014 to 2023 | 10 | 17,601 | 17.5 | 18.2 | 1,300 | 20.6 | 21.7 |
| New Jersey | 2014 to 2022 | 9 | 950,679 | 11.4 | 10.8 | |||
| Rhode Island | 2014 to 2018 | 5 | 1,756 | 2.3 | 23.8 | |||
| Louisiana | 2014 to 2022 | 9 | 15,537 | 2.2 | 2.1 | 2.2 |
Blank cells mean the state sent no counts for that period. State programs collect different test populations, so states are not directly comparable to each other.
Source: [2][1] CDC National Environmental Public Health Tracking Network; CDC National Environmental Public Health Tracking Network
16 states make sellers hand over a radon notice or test results; 15 have no seller rule
KBR classified every radon law in ELI's 2026 database for 50 states and DC. 16 require a radon-specific notice, pamphlet or test results at sale, 7 require radon-resistant features in all new homes, and 15 license or certify mitigators themselves.
The Environmental Law Institute radon excerpt lists 155 state law entries enacted through June 2026. KBR read each and asked three questions: does a seller have to tell a buyer about radon, must new homes be built radon-resistant, and who may install a mitigation system. Minnesota's Radon Awareness Act is typical of the strongest seller rules: a written disclosure, a radon warning statement and a state publication, in force since January 1, 2014.
Number of 51 jurisdictions, laws enacted through June 2026
Source: Environmental Law Institute, Database of State Indoor Air Quality Laws, radon excerpt (2026); KBR classification.
| Question | Strongest rule | Partial rule | No rule found |
|---|---|---|---|
| Disclosure when a home is sold | 16 radon notice, pamphlet or test results | 20 radon on a general seller form | 15 none found |
| Radon-resistant new homes | 7 statewide | 6 Zone 1 or set areas; 5 voluntary or limited | 33 none found |
| Who may fix radon | 15 state credential | 5 national certification by law; 1 contractor license; 1 testers only | 29 none found |
Counts of 51 jurisdictions, classified by KBR from ELI's 2026 radon excerpt. 'None found' means ELI lists no such law; local codes are not included.
Source: [20][18][19] Environmental Law Institute; Minnesota Office of the Revisor of Statutes; Illinois Emergency Management Agency and Office of Homeland Security
Only Illinois, Iowa, Minnesota and Nebraska have the strongest form of all three rules; 48.8 percent of their 377,848 lab tests were high. 12 states have none of the three, including Wyoming (44.3 percent high) and Idaho (41.5 percent). Across the no-rule states with lab data, 28.8 percent of 151,353 tests were high. Of the ten states with the highest share of high tests, 6 have a radon-specific seller rule.
What 4 pCi/L means next to the 1.3 national average and EPA's 21,000 estimate
EPA's 4 pCi/L action level is about three times its 1.3 pCi/L estimate of the average US home, and ten times the 0.4 pCi/L outdoor average. The 21,000 deaths figure is a model built on that average, not a count.
| Measure | Value | Metric equivalent | Source |
|---|---|---|---|
| EPA action level (fix the home) | 4 pCi/L | 150 Bq/m3 | EPA |
| EPA: consider fixing | 2 to 4 pCi/L | 75 to 150 Bq/m3 | EPA |
| WHO 2009 reference level | 2.7 pCi/L | 100 Bq/m3 | WHO via EPA |
| WHO 2009 upper limit | 8.1 pCi/L | 300 Bq/m3 | WHO via EPA |
| Average US indoor level (1991 survey) | 1.3 pCi/L | 50 Bq/m3 | EPA |
| Average US outdoor level | 0.4 pCi/L | 15 Bq/m3 | EPA |
| Radon lung cancer deaths a year (estimate) | 21,000 | EPA | |
| Of which never smokers | 2,900 | EPA |
The 21,000 figure is EPA's modelled estimate built on the 1.3 pCi/L national average.
Source: [7][8][9][10] U.S. Environmental Protection Agency; U.S. Environmental Protection Agency; U.S. Environmental Protection Agency; U.S. Environmental Protection Agency
EPA estimates that radon causes about 21,000 lung cancer deaths a year, about 2,900 among people who never smoked. At 1.3 pCi/L, EPA's risk table gives a never smoker about a 2 in 1,000 lifetime chance of lung cancer and a smoker about 20 in 1,000. The World Health Organization's 2009 handbook set a lower reference level of 2.7 pCi/L where possible; EPA kept 4 pCi/L and points to its existing advice to consider fixing from 2 to 4.
The national average itself comes from a residential survey completed in 1991. EPA's FAQ still cites that 1991 survey, which is why test-result shares such as those above are the most current state picture available, with their selection bias.
Testing, finished basements and what mitigation costs, from agency guidance
CDC and EPA describe short-term tests of 2 to 90 days and long-term tests of more than 90 days. Minnesota's health department puts typical mitigation systems at $1,500 to $3,000.
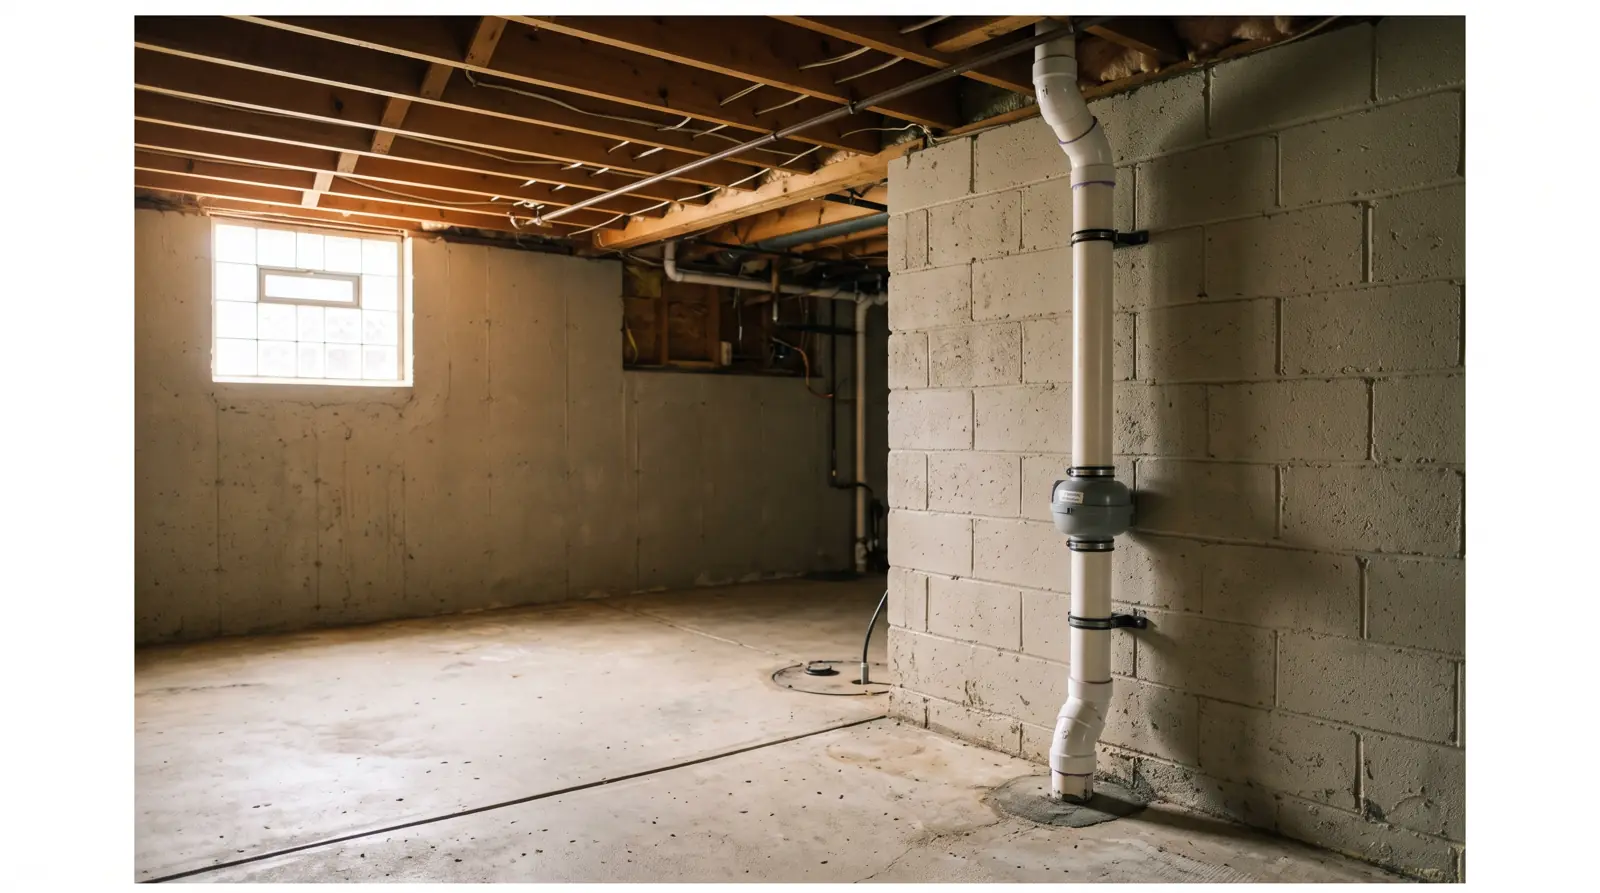
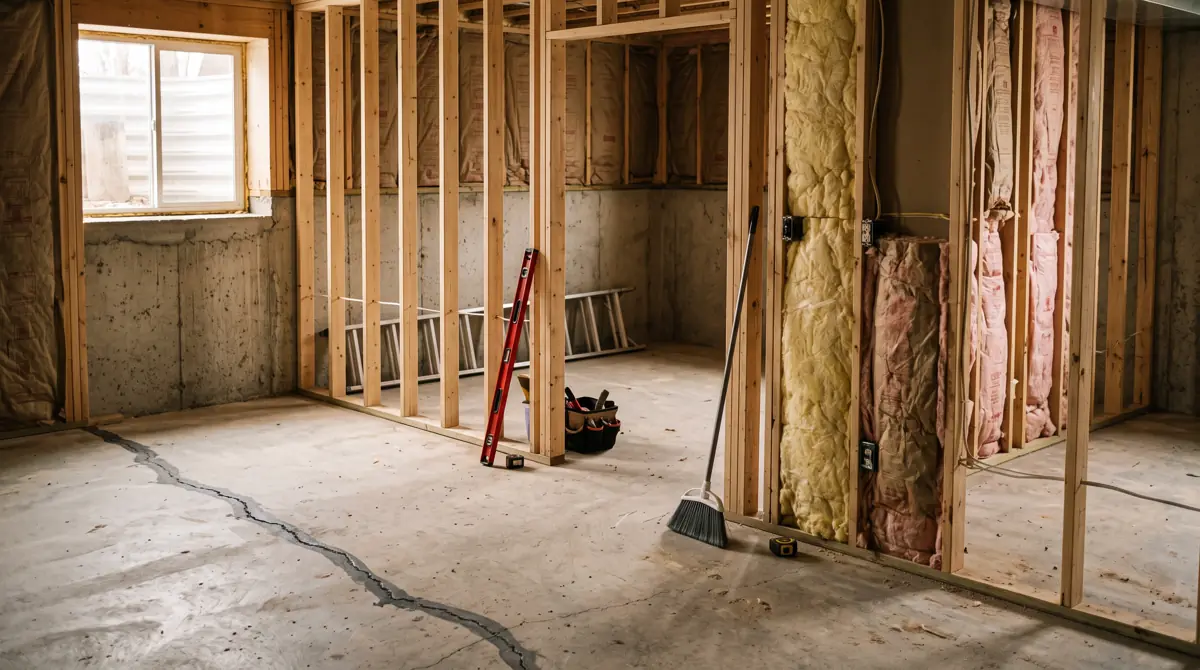
CDC advises testing when a home has never been tested, when buying or selling, before and after renovations, and before anyone starts spending more time in a basement or lower level, such as when a basement becomes a bedroom or office. The test goes in the lowest lived-in level. For homeowners planning a lower-level remodel, that puts the test before drywall goes up; see the remodel timeline for where it fits.
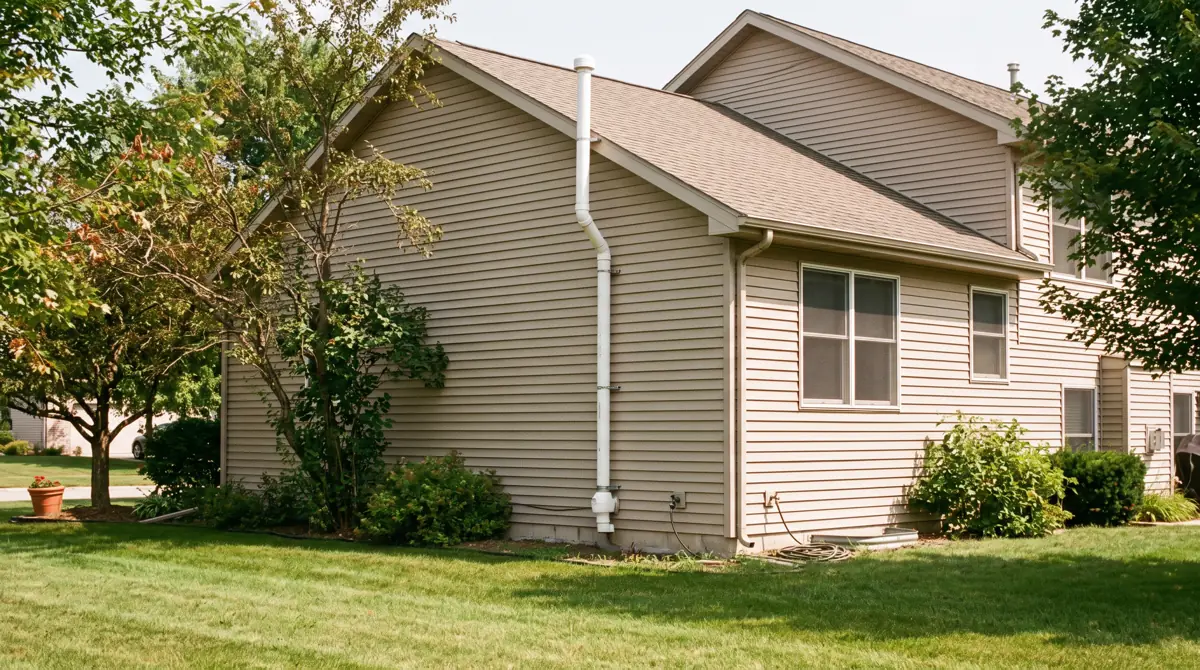
EPA does not publish a dollar figure; it says most homes can be fixed for about the same cost as other common home repairs and that some systems cut radon by up to 99 percent. The Minnesota Department of Health gives a range of $1,500 to $3,000. Twenty jurisdictions require a state credential or national certification for mitigators; elsewhere, the questions for choosing a contractor apply, and the contractor directory lists remodelers by city.
State radon laws: disclosure at sale, new construction and mitigator credentials (through June 2026)
Checked annually, when ELI updates its database. Last checked 2026-11-02. Entries are neutral records of public data; each links to its source record.
| State | What the law requires (KBR coding of ELI abstracts) | Date | Evidence | Source |
|---|---|---|---|---|
| Alabama | Sale: None found (No seller radon provision listed). New homes: None found (No statewide residential provision listed). Mitigators: None found. | 2026-06-30 | corroborated | Record |
| Alaska | Sale: On general seller form (Alaska Stat. 34.70: seller form covers radon gas). New homes: None found (No statewide residential provision listed). Mitigators: None found. | 2026-06-30 | corroborated | Record |
| Arizona | Sale: None found (No seller radon provision listed). New homes: None found (No statewide residential provision listed). Mitigators: None found. | 2026-06-30 | corroborated | Record |
| Arkansas | Sale: None found (No seller radon provision listed). New homes: None found (No statewide residential provision listed). Mitigators: None found. | 2026-06-30 | corroborated | Record |
| California | Sale: On general seller form (Cal. Civ. Code 1102: seller form covers radon gas). New homes: Voluntary or limited (H&S Code 105430: agency may set rules for at-risk areas). Mitigators: National cert. required. | 2026-06-30 | corroborated | Record |
| Colorado | Sale: Radon notice or test results (C.R.S. 38-35.7-112: state radon pamphlet, written disclosure, bold radon statement in sale contract). New homes: Voluntary or limited (Factory-built structures only: rules with IRC Appendix AF effective June 30, 2026). Mitigators: State credential. Colorado radon professional licensing is scheduled to end in September 2027 (ELI). | 2026-06-30 | corroborated | Record |
| Connecticut | Sale: On general seller form (Conn. Gen. Stat. 20-327b: report covers radon test results and control systems known to seller). New homes: Statewide (2022 State Building Code: passive features in new 1 and 2 family homes and townhouses). Mitigators: National cert. required. | 2026-06-30 | corroborated | Record |
| Delaware | Sale: Radon notice or test results (Del. Code tit. 6, 2570-2578: radon test disclosure form and state radon information). New homes: None found (No statewide residential provision listed). Mitigators: None found. | 2026-06-30 | corroborated | Record |
| District of Columbia | Sale: On general seller form (D.C. Code 42-1301: seller statement covers radon). New homes: Statewide (D.C. residential code: amended IRC Appendix F). Mitigators: National cert. required. | 2026-06-30 | corroborated | Record |
| Florida | Sale: Radon notice or test results (Fla. Stat. 404.056: radon warning statement before sale or lease). New homes: Voluntary or limited (Fla. Stat. 553.98: voluntary model standard for local adoption). Mitigators: State credential. | 2026-06-30 | corroborated | Record |
| Georgia | Sale: None found (No seller radon provision listed). New homes: None found (No statewide residential provision listed). Mitigators: None found. | 2026-06-30 | corroborated | Record |
| Hawaii | Sale: None found (No seller radon provision listed). New homes: None found (No statewide residential provision listed). Mitigators: None found. | 2026-06-30 | corroborated | Record |
| Idaho | Sale: None found (No seller radon provision listed). New homes: None found (No statewide residential provision listed). Mitigators: None found. | 2026-06-30 | corroborated | Record |
| Illinois | Sale: Radon notice or test results (420 ILCS 46: state pamphlet and disclosure of known elevated radon). New homes: Statewide (420 ILCS 52: passive techniques in all new residential construction). Mitigators: State credential. | 2026-06-30 | corroborated | Record |
| Indiana | Sale: On general seller form (Ind. Code 32-21-5: seller form covers radon gas). New homes: None found (No statewide residential provision listed). Mitigators: State credential. | 2026-06-30 | corroborated | Record |
| Iowa | Sale: Radon notice or test results (Iowa Code 558A: form lists radon test results; buyer acknowledges state radon fact sheet). New homes: Statewide (Iowa Code 103A.8E: passive system per IRC 2021 Appendix AF in new 1 and 2 family homes). Mitigators: State credential. | 2026-06-30 | corroborated | Record |
| Kansas | Sale: Radon notice or test results (K.S.A. 58-3078a: radon notice in every residential sale contract). New homes: None found (No statewide residential provision listed). Mitigators: State credential. | 2026-06-30 | corroborated | Record |
| Kentucky | Sale: Radon notice or test results (KRS 324.360: seller form asks about radon tests and systems and carries a state radon statement). New homes: None found (No statewide residential provision listed). Mitigators: State credential. | 2026-06-30 | corroborated | Record |
| Louisiana | Sale: On general seller form (La. R.S. 9:3198: seller form covers radon). New homes: None found (No statewide residential provision listed). Mitigators: None found. | 2026-06-30 | corroborated | Record |
| Maine | Sale: On general seller form (33 M.R.S. 173: seller statement covers radon). New homes: Statewide (10 M.R.S. 9722: ASTM E1465 mandatory in state building code). Mitigators: State credential. | 2026-06-30 | corroborated | Record |
| Maryland | Sale: On general seller form (Md. Real Prop. 10-702: disclosure form covers radon). New homes: Zone 1 or set areas (Md. Building Performance Standards: IRC Appendix F in Zone 1 counties). Mitigators: Testers only. | 2026-06-30 | corroborated | Record |
| Massachusetts | Sale: None found (Buyer brochure on home inspections mentions radon (M.G.L. ch. 13, 97); no seller radon duty listed). New homes: Zone 1 or set areas (780 CMR 51 App. F: passive systems in Zone 1 counties). Mitigators: None found. | 2026-06-30 | corroborated | Record |
| Michigan | Sale: On general seller form (MCL 565.951: seller statement covers radon gas). New homes: Zone 1 or set areas (Michigan Residential Code Appendix F: Zone 1 counties). Mitigators: None found. | 2026-06-30 | corroborated | Record |
| Minnesota | Sale: Radon notice or test results (Minn. Stat. 144.496: written radon disclosure, warning and MDH publication (effective 2014)). New homes: Statewide (Minn. Stat. 326B.106: amended Appendix F in all new residential construction). Mitigators: State credential. | 2014-01-01 | agency record | Record |
| Mississippi | Sale: None found (No seller radon provision listed). New homes: None found (No statewide residential provision listed). Mitigators: None found. | 2026-06-30 | corroborated | Record |
| Missouri | Sale: None found (No seller radon provision listed). New homes: None found (No statewide residential provision listed). Mitigators: None found. | 2026-06-30 | corroborated | Record |
| Montana | Sale: Radon notice or test results (MCA 75-3-601 to 607: radon warning statement and known test results to buyers). New homes: None found (No statewide residential provision listed). Mitigators: None found. | 2026-06-30 | corroborated | Record |
| Nebraska | Sale: Radon notice or test results (Neb. Rev. Stat. 76-2,120: form requires copies of radon tests and mitigation details). New homes: Statewide (Neb. Rev. Stat. 76-3501: passive elements, with exceptions incl. counties averaging under 2.7 pCi/L). Mitigators: State credential. | 2026-06-30 | corroborated | Record |
| Nevada | Sale: None found (No seller radon provision listed). New homes: None found (No statewide residential provision listed). Mitigators: None found. | 2026-06-30 | corroborated | Record |
| New Hampshire | Sale: Radon notice or test results (RSA 477:4-a: radon notification statement before a sale contract). New homes: None found (No statewide residential provision listed). Mitigators: National cert. required. | 2026-06-30 | corroborated | Record |
| New Jersey | Sale: Radon notice or test results (N.J.S.A. 26:2D-73: radon test results to buyer once under contract). New homes: Zone 1 or set areas (N.J.A.C. 5:23-10 Radon Hazard Subcode: designated areas). Mitigators: State credential. | 2026-06-30 | corroborated | Record |
| New Mexico | Sale: None found (No seller radon provision listed). New homes: None found (No statewide residential provision listed). Mitigators: None found. | 2026-06-30 | corroborated | Record |
| New York | Sale: Radon notice or test results (N.Y. Real Prop. Law 462: radon testing disclosure and copies of reports). New homes: None found (No statewide residential provision listed). Mitigators: None found. | 2026-06-30 | corroborated | Record |
| North Carolina | Sale: On general seller form (N.C.G.S. 47E: seller statement covers radon gas). New homes: None found (No statewide residential provision listed). Mitigators: None found. | 2026-06-30 | corroborated | Record |
| North Dakota | Sale: Radon notice or test results (N.D.C.C. 47-10-02.2: written disclosure of known radon and test results). New homes: None found (No statewide residential provision listed). Mitigators: None found. | 2026-06-30 | corroborated | Record |
| Ohio | Sale: On general seller form (ORC 5302.30: seller form covers radon). New homes: None found (No statewide residential provision listed). Mitigators: State credential. | 2026-06-30 | corroborated | Record |
| Oklahoma | Sale: On general seller form (60 O.S. 831: seller form covers radon and radon testing). New homes: None found (No statewide residential provision listed). Mitigators: None found. | 2026-06-30 | corroborated | Record |
| Oregon | Sale: On general seller form (ORS 105.462: seller statement covers radon testing or treatment). New homes: Zone 1 or set areas (ORS 455.365: seven named counties plus others the agency adds). Mitigators: None found. | 2026-06-30 | corroborated | Record |
| Pennsylvania | Sale: On general seller form (68 Pa. Stat. 7301: seller statement covers radon). New homes: None found (No statewide residential provision listed). Mitigators: State credential. | 2026-06-30 | corroborated | Record |
| Rhode Island | Sale: Radon notice or test results (R.I. Gen. Laws 5-20.8: form must carry a statutory radon testing statement). New homes: None found (No statewide residential provision listed). Mitigators: State credential. | 2026-06-30 | corroborated | Record |
| South Carolina | Sale: On general seller form (S.C. Code 27-50: seller statement covers radon gas). New homes: None found (No statewide residential provision listed). Mitigators: None found. | 2026-06-30 | corroborated | Record |
| South Dakota | Sale: On general seller form (SDCL 43-4-37: seller form covers radon and testing). New homes: None found (No statewide residential provision listed). Mitigators: None found. | 2026-06-30 | corroborated | Record |
| Tennessee | Sale: On general seller form (Tenn. Code 66-5-201: seller form covers radon gas). New homes: None found (No statewide residential provision listed). Mitigators: None found. | 2026-06-30 | corroborated | Record |
| Texas | Sale: On general seller form (Tex. Prop. Code 5.008: seller notice covers radon). New homes: None found (No statewide residential provision listed). Mitigators: None found. | 2026-06-30 | corroborated | Record |
| Utah | Sale: None found (No seller radon provision listed). New homes: Voluntary or limited (Utah Code 15A-3-206: voluntary installs must meet Appendix F). Mitigators: Contractor license. | 2026-06-30 | corroborated | Record |
| Vermont | Sale: None found (No seller radon provision listed). New homes: None found (No statewide residential provision listed). Mitigators: None found. | 2026-06-30 | corroborated | Record |
| Virginia | Sale: Radon notice or test results (Va. Code 55.1-703: disclosure statement on EPA radon zones). New homes: Voluntary or limited (USBC: Appendix F for localities that opt in). Mitigators: National cert. required. | 2026-06-30 | corroborated | Record |
| Washington | Sale: On general seller form (RCW 64.06: seller statement covers radon gas). New homes: Zone 1 or set areas (WAC 51-51: Zone 1 counties and unvented crawl spaces). Mitigators: None found. | 2026-06-30 | corroborated | Record |
| West Virginia | Sale: None found (No seller radon provision listed). New homes: None found (No statewide residential provision listed). Mitigators: State credential. | 2026-06-30 | corroborated | Record |
| Wisconsin | Sale: On general seller form (Wis. Stat. 709: condition report covers radon). New homes: None found (No statewide residential provision listed). Mitigators: None found. | 2026-06-30 | corroborated | Record |
| Wyoming | Sale: None found (No seller radon provision listed). New homes: None found (No statewide residential provision listed). Mitigators: None found. | 2026-06-30 | corroborated | Record |
State-by-state findings
- 35.7 percent of 2,013,544 pre-mitigation radon tests reported by labs to CDC for 2008 to 2017 read 4 pCi/L or higher, across 46 states and DC.[1]
- North Dakota had the highest share of high lab results, 59.3 percent of 6,607 tests, 2008 to 2017.[1]
- Nebraska (58.5 percent of 42,782), South Dakota (58.5 percent) and Iowa (58.5 percent of 95,245) follow, 2008 to 2017.[1]
- Louisiana had the lowest share, 2.2 percent of 499 lab tests, followed by DC at 8.7 percent and Texas at 10.2 percent, 2008 to 2017.[1]
- In EPA Zone 1 counties, 42.4 percent of 1,217,840 lab tests read 4 pCi/L or higher, 2008 to 2017.[1][4]
- In EPA Zone 3 counties, where the 1993 map predicts averages under 2 pCi/L, 15.3 percent of 172,195 lab tests still read 4 pCi/L or higher.[1][4]
- 19 of 158 Zone 3 counties with 100 or more lab tests had 25 percent or more of tests at or above 4 pCi/L; King George County, Virginia, led at 45.5 percent.[1][4]
- Zone 1 counties produced 60.5 percent of lab tests while holding 26.3 percent of residents in the 47 jurisdictions with data; Zone 3 produced 8.6 percent of tests for 38.8 percent of residents.[1][4][5]
- Utah has 4.1 percent of residents in Zone 1 but 41.9 percent of its 28,342 lab tests read 4 pCi/L or higher.[1][4][5]
- Oregon has no Zone 1 county, yet 25.4 percent of 23,951 lab tests read 4 pCi/L or higher, 2008 to 2017.[1][4]
- EPA puts 26.2 percent of US residents (89,540,604 people in 2025) in Zone 1 counties.[4][5]
- 16 of 51 jurisdictions require a radon-specific notice, pamphlet or test results at sale; 15 have no seller radon rule in ELI's database through June 2026.[20]
- 7 jurisdictions (Connecticut, DC, Illinois, Iowa, Maine, Minnesota, Nebraska) require radon-resistant features in all new homes; 6 more require them only in Zone 1 or named areas.[20]
- Wyoming ranks ninth for high lab results (44.3 percent) and has none of the three radon laws tracked here.[1][20]
- EPA estimates radon causes about 21,000 lung cancer deaths a year in the US, about 2,900 of them among people who never smoked.[7]
Rankings and ratios we derived
Share of lab radon tests at or above 4 pCi/L, by state and 47-jurisdiction total
Formulasum of county counts at or above 4 / sum of all county counts x 100 (never an average of county percents)
Inputs: fact sheet rows for lab totals and each state; tables/t1_state_atlas.csv (fact sheet rows)
Result: 35.7 percent nationally; North Dakota 59.3 percent; Louisiana 2.2 percent
A ranking of where reported tests most often come back high, not of average radon in homes.
Limitations: Self-selected tests, 2008 to 2017; four states missing.
High-result share by EPA zone (signature)
Formulacounty counts joined to EPA's 1993 zone by FIPS, summed by zone
Inputs: s1 county rows, s4 zone list; tables/t3_zones.csv; derived d21 to d23 (fact sheet rows)
Result: Zone 1 42.4 percent; Zone 2 28.2; Zone 3 15.3
The map orders counties correctly; high results are 2.8 times as common in Zone 1 as in Zone 3, but 15.3 percent of Zone 3 tests were high.
Limitations: One county with 3 tests did not match; zone boundaries are 1993 counties.
Testing intensity by zone (signature)
Formulatests per 1,000 residents = zone tests / zone 2025 population x 1,000; ratio Zone 1 / Zone 3
Inputs: tables/t3_zones.csv; derived d51, d53, d6 (fact sheet rows)
Result: 14.23 vs 1.37 tests per 1,000 residents: 10.4 times
People in Zone 1 counties test far more, so fewer high homes are found in Zone 3.
Limitations: Ten years of tests over a 2025 population; repeat tests of one building count twice.
Zone 3 counties that test like Zone 2 or worse
FormulaZone 3 counties with 100+ tests where tests at or above 4 / tests >= 25 percent
Inputs: tables/t4_zone3_counties.csv; derived d8, d9 (fact sheet rows)
Result: 19 of 158 counties, 40,980 tests
Low-zone counties with many high results are where the 1993 prediction is weakest.
Limitations: The 25 percent and 100-test cut-offs are KBR's choices.
States testing above their zone map
Formulastates with under 10 percent of residents in Zone 1 and 20 percent or more of lab tests at or above 4, 1,000+ tests
Inputs: tables/t1_state_atlas.csv; derived d13 to d13c (fact sheet rows)
Result: 7 states; 26.3 percent of 216,364 tests high
Utah, New Hampshire and Oregon in particular return far more high results than their zone shares suggest.
Limitations: Thresholds are KBR's; Connecticut shows that lab and state-program data can disagree.
State radon law registry counts
Formulacount of 51 jurisdictions per KBR category, from ELI 2026 abstracts
Inputs: tables/registry.csv; derived d19a to d22c (fact sheet rows)
Result: Sale: 16 radon-specific, 20 general form, 15 none. New homes: 7 statewide, 6 zoned. Mitigators: 15 state credential, 5 national certification
Rules cluster in the upper Midwest and Northeast; several high-test Mountain West states have none.
Limitations: ELI says its chart does not list every law that touches radon; local codes excluded.
Executive summary
- Across 2,013,544 pre-mitigation radon tests that labs reported to CDC for 2008 to 2017, 35.7 percent read at or above EPA's 4 pCi/L action level (718,943 tests, 46 states and DC).
- North Dakota (59.3 percent), Nebraska (58.5 percent), South Dakota (58.5 percent) and Iowa (58.5 percent) post the highest shares; Louisiana (2.2 percent) and DC (8.7 percent) the lowest.
- EPA's 1993 zones put counties in the right order: 42.4 percent of tests were high in Zone 1 counties, 28.2 percent in Zone 2 and 15.3 percent in Zone 3.
- The low zone is not a safe zone: in 19 of 158 Zone 3 counties with at least 100 tests, a quarter or more of results were 4 pCi/L or higher.
- Testing follows the map more than the risk: Zone 1 counties hold 26.3 percent of residents but produced 60.5 percent of tests, 10.4 times the per-person testing rate of Zone 3.
- Seven states with under 10 percent of residents in Zone 1 (Utah, New Hampshire, Oregon, Nevada, Florida, North Carolina, Vermont) returned 26.3 percent high results across 216,364 tests.
- State law, through June 2026: 16 states require a radon notice or test results at sale, 20 list radon on a general seller form and 15 have no seller rule; 7 require radon-resistant features in all new homes.
- The newest CDC counts are state-program data for 2023 from 11 states: 33.4 percent of 128,740 tests were at or above 4 pCi/L.
Questions people ask
What is a normal radon level?
EPA puts the average US indoor level at about 1.3 pCi/L, from a national survey completed in 1991, and the average outdoor level at about 0.4 pCi/L. EPA recommends fixing a home at 4 pCi/L or more and considering a fix from 2 to 4. In CDC's 2008 to 2017 lab data, 35.7 percent of reported tests were at or above 4, but those are self-selected tests.
How do I test for radon?
CDC describes short-term kits that measure for 2 to 90 days and long-term kits that measure for more than 90 days; long-term results better reflect the year-round average. The device goes in the lowest lived-in level. State radon offices list testers, and some offer free or discounted kits. EPA recommends a qualified tester for a home sale.
Does a finished basement need radon mitigation?
Only a test can say. CDC advises testing before anyone starts spending more time in a basement, such as converting it to a bedroom or office, and again after renovations. EPA's buyer guidance says a new test is reasonable if the home has been renovated since the last test or the buyer will live on a lower level than was tested.
How much does radon mitigation cost?
EPA gives no dollar figure and says most homes can be fixed for about the same cost as other common home repairs. The Minnesota Department of Health puts typical systems at $1,500 to $3,000, depending on the system type and how the home was built. That is one state's range, not a national price.
Download the data
Every table in this report is available as a CSV under CC BY 4.0. The fact sheet lists each value with its source URL and access date.
For journalists and researchers
If you cite only a few, cite these
- In counties EPA's 1993 map rates as low-radon Zone 3, 15.3 percent of lab tests still came back at or above 4 pCi/L.[1][4]
- Residents of EPA Zone 1 counties were tested 10.4 times as often per person as Zone 3 residents, 2008 to 2017.[1][4][5]
- 16 of 51 jurisdictions require sellers to give buyers a radon notice, pamphlet or test results; 15 have no seller radon rule.[20]
Most quotable statistics
- 35.7 percent of 2,013,544 home radon tests reported to CDC by labs for 2008 to 2017 read at or above EPA's 4 pCi/L action level.[1]
- In counties EPA's 1993 map rates as low-radon Zone 3, 15.3 percent of lab tests still came back at or above 4 pCi/L.[1][4]
- Residents of EPA Zone 1 counties were tested 10.4 times as often per person as Zone 3 residents, 2008 to 2017.[1][4][5]
- North Dakota leads the radon map: 59.3 percent of its lab tests read 4 pCi/L or higher.[1]
- Utah has 4.1 percent of residents in EPA Zone 1 but 41.9 percent of its lab radon tests were at or above 4 pCi/L.[1][4][5]
- 16 of 51 jurisdictions require sellers to give buyers a radon notice, pamphlet or test results; 15 have no seller radon rule.[20]
Press summary
A Kitchen and Bath Renovators analysis of 2,013,544 radon tests reported to CDC finds that EPA's 1993 radon zone map ranks counties correctly but misses many high homes in its low zone. Between 2008 and 2017, 35.7 percent of lab tests across 46 states and DC read at or above EPA's 4 pCi/L action level. North Dakota led at 59.3 percent. In Zone 1 counties, 42.4 percent of tests were high; in Zone 3 counties, predicted to average under 2 pCi/L, 15.3 percent were. Zone 1 residents were tested 10.4 times as often per person as Zone 3 residents, so fewer high homes are found where the map says risk is low. Utah, Oregon and New Hampshire return far more high results than their zone shares suggest. A registry of state laws through June 2026 finds 16 states require a radon-specific notice at sale and 7 require radon-resistant features in all new homes. Test data are self-selected, not a random sample.
Suggested headlines
- 15.3% of radon tests in EPA's 'low' zone still hit the action level
- Radon map: North Dakota tops states with 59.3 percent of tests high
- Zone 1 residents test for radon 10.4 times as often as Zone 3 residents
- Utah, Oregon and New Hampshire test far above their 1993 radon zones
- Only 16 states make sellers hand over a radon notice or test results
How to cite this report
Kitchen and Bath Renovators. (2026). Radon Map: Test Results by State vs EPA's 1993 Zones. Retrieved from https://kitchenandbathrenovators.com/research/radon-map/
Reuse license
Data and tables are licensed CC BY 4.0. Attribution: “Source: Kitchen and Bath Renovators, Radon Map: Test Results by State vs EPA's 1993 Zones” with a link to this page.
Frequently asked questions
Which state has the highest radon test results?
North Dakota, with 59.3 percent of 6,607 lab tests at or above 4 pCi/L in CDC's 2008 to 2017 data. Nebraska, South Dakota and Iowa follow near 58.5 percent.
Which state has the lowest radon test results?
Louisiana, at 2.2 percent of 499 lab tests, followed by DC (8.7 percent) and Texas (10.2 percent), in CDC's 2008 to 2017 lab data.
How old is EPA's radon zone map?
EPA developed it in 1993 from indoor measurements, geology, aerial radioactivity, soil data and foundation types. The county zones have not been redrawn; EPA's zone page dates the current text version of the county list to September 2025.
Can a home in Zone 3 have high radon?
Yes. In CDC lab data, 15.3 percent of 172,195 tests from Zone 3 counties read 4 pCi/L or higher, and 19 Zone 3 counties with 100 or more tests had a quarter or more of results that high.
What share of Americans live in EPA Zone 1?
26.2 percent, or 89,540,604 people, using Census Vintage 2025 county estimates matched to EPA's 1993 zone list.
Do states require radon disclosure when a home is sold?
16 states (including DC) require a radon-specific notice, pamphlet or test results, 20 list radon on a general seller disclosure form, and 15 have no seller radon rule in ELI's database through June 2026.
Which states require radon-resistant construction in new homes?
Statewide: Connecticut, DC, Illinois, Iowa, Maine, Minnesota and Nebraska (Nebraska with exceptions). Maryland, Massachusetts, Michigan, New Jersey, Oregon and Washington apply it only in Zone 1 or named areas.
Do radon mitigators need a license?
15 states issue their own license, certification or registration, and 5 (California, Connecticut, DC, New Hampshire, Virginia) require national certification by law. Utah requires a contractor license. 29 states have no such law in ELI's database.
How many deaths does radon cause?
EPA estimates about 21,000 lung cancer deaths a year in the US, about 2,900 among people who never smoked. The estimate is modelled from the 1.3 pCi/L national average, not counted from death records.
What is the newest radon test data from CDC?
State-program counts for 2023, from 11 states: 33.4 percent of 128,740 tests were at or above 4 pCi/L. The broader lab series ends with the 2008 to 2017 window.
Reproduce this analysis
Every figure comes from the files below. The scripts that pulled and computed them are kept with the report and can be re-run.
| Dataset | Publisher | Source | Query or filter | Rows used | Retrieved |
|---|---|---|---|---|---|
| Radon Tests from Labs, measure 866 (pre-mitigation tests by radon level over a 10-year period) | CDC National Environmental Public Health Tracking Network | File or endpoint | stratification level 2189 (state x county x concentration), temporal type 2 (multi-year) item 2017 = 2008 to 2017, RadonCutpointId 1, 2, 3 | 8,790 county-level cells, 47 jurisdictions | 2026-11-02 |
| Radon Tests from States, measure 743 (annual pre-mitigation tests by radon level) | CDC National Environmental Public Health Tracking Network | File or endpoint | same stratification; temporal type 1, one call per year 2014 to 2023 | 22 states with any year of data | 2026-11-02 |
| Text Version: Radon Zones Map (county spreadsheet) | U.S. Environmental Protection Agency | File or endpoint | sheet un-filtered-raw-data; rows with zone 1, 2 or 3 | 3,144 counties | 2026-11-02 |
| County population estimates, Vintage 2025 | U.S. Census Bureau | File or endpoint | SUMLEV 50, POPESTIMATE2025 | all counties except Connecticut planning regions | 2026-11-02 |
| County population estimates, Vintage 2021 | U.S. Census Bureau | File or endpoint | SUMLEV 50, STNAME Connecticut, POPESTIMATE2021 | 8 Connecticut legacy counties | 2026-11-02 |
| Database of State Indoor Air Quality Laws: radon excerpt | Environmental Law Institute | File or endpoint | all entries; coded for seller disclosure, new construction and mitigator credentials | 155 entries, 42 jurisdictions with any entry | 2026-11-02 |
Data quality and exclusions
- Lab file: 8,790 county-level cells (county x three concentration bands); 807 cells read No Events and were counted as zero. No cells carried a suppression flag.
- Hawaii, Kansas, Mississippi and New Jersey have no lab data in the 2008 to 2017 window and are blank on the tile map; Kansas and New Jersey appear in the state-program table.
- EPA zone list: 3,144 counties. 56 rows needed a name fix before matching Census names: 41 Virginia independent cities, eight Connecticut legacy counties (matched to Vintage 2021 population), Doña Ana (accent), Shannon County SD (now Oglala Lakota), and four Alaska areas renamed or split since 1993.
- 4 EPA rows have no current Census county (Yellowstone National Park, and the former Virginia cities of Bedford, Clifton Forge and South Boston) and carry zero population. Hoonah-Angoon, Alaska, split from a Zone 3 area, was assigned Zone 3 for population only.
- County join: 2,661 counties had lab tests; one (Valdez-Cordova, Alaska, 3 tests) has no current FIPS match and is left out of zone totals only.
- State-program data: states enter and leave the series by year (11 states in 2023, 19 in 2014), so only within-state comparisons are made; NJ and RI values look like definition differences and are flagged, not dropped.
Methodology
Source selection: state test shares come only from CDC's Environmental Public Health Tracking Network API, the federal compilation of radon test counts. Zones come from EPA's county spreadsheet of the 1993 map. Population comes from Census Bureau county estimates. Health and action-level figures come from EPA and CDC pages. State laws come from the Environmental Law Institute's 2026 radon excerpt, with Minnesota and Illinois checked against official pages.
Retrieval: the keyless API was called with the request format used in CDC's own EPHTrackR package, county geography, concentration-level stratification (under 2, 2 to under 4, 4 or higher). Lab data (measure 866) were pulled for the latest 10-year window, 2008 to 2017; state-program data (measure 743) for each year 2014 to 2023. The keyless tier allows few requests a minute, so calls were spaced and retried.
Calculations: state and zone shares are sums of county counts at or above 4 pCi/L divided by sums of all county counts, never averages of county percents. Zones were joined to CDC counties by FIPS after matching EPA county names to Census names; renamed, split and merged counties are handled as described in the data-quality notes. Tests per 1,000 residents divide ten years of tests by the July 1, 2025 population of the same counties.
Registry: each of the 155 ELI entries was read and coded for three questions: seller disclosure (radon-specific notice or test results; radon on a general form; none), radon-resistant new construction for homes (statewide; Zone 1 or named areas; voluntary or limited; none) and mitigator credentials (state credential; national certification required by law; contractor license; testers only; none). School, child care and funding laws were not coded. The registry is checked against ELI's annual update; last checked 2026-11-02.
Conflicts: where lab and state-program data disagree for a state (Connecticut, Rhode Island, New Jersey), both are shown and neither is preferred. The EPA zone web page date (August 2026) and spreadsheet posting (September 2025) do not change the 1993 zones.
Limitations: tests are self-selected and concentrated in real estate transactions and high-radon areas; repeat tests of one building may count more than once; four states lack lab data; the lab series stops at 2017. None of this measures the radon level of any specific home.
Last updated 2026-11-02.
This report presents published data with its limitations. It is not legal, financial or investment advice.
Sources, ranked by quality
Tier 1: primary and official sources (25)
- [1] CDC National Environmental Public Health Tracking Network. Radon Tests from Labs: Number of Pre-mitigation Radon Tests by Radon Level over a 10-year Period (measure 866), county x concentration, 2008 to 2017. 2008 to 2017. Accessed 2026-11-02.
- [2] CDC National Environmental Public Health Tracking Network. Radon Tests from States: Annual Number of Pre-mitigation Radon Tests by Radon Level (measure 743), county x concentration, 2014 to 2023. 2014 to 2023. Accessed 2026-11-02.
- [3] U.S. Environmental Protection Agency. The EPA Map of Radon Zones (web page, last updated August 17, 2026). 1993 map. Accessed 2026-11-02.
- [4] U.S. Environmental Protection Agency. Text Version: Radon Zones Map (county spreadsheet, September 2025 posting). 1993 zones. Accessed 2026-11-02.
- [5] U.S. Census Bureau. County Population Totals: Vintage 2025 (co-est2025-alldata). July 1, 2025. Accessed 2026-11-02.
- [6] U.S. Census Bureau. County Population Totals: Vintage 2021 (co-est2021-alldata), used for Connecticut's eight legacy counties. July 1, 2021. Accessed 2026-11-02.
- [7] U.S. Environmental Protection Agency. Health Risk of Radon. EPA 2003 risk assessment. Accessed 2026-11-02.
- [8] U.S. Environmental Protection Agency. What is the average level of radon found in homes in the U.S.?. 1991 national residential survey. Accessed 2026-11-02.
- [9] U.S. Environmental Protection Agency. What is EPA's Action Level for Radon and What Does it Mean?. current guidance. Accessed 2026-11-02.
- [10] U.S. Environmental Protection Agency. Does the 2009 World Health Organization's recommendation of a lower radon action level affect the EPA's radon action level?. 2009 WHO handbook. Accessed 2026-11-02.
- [11] U.S. Environmental Protection Agency. A Citizen's Guide to Radon (December 2016). 2016. Accessed 2026-11-02.
- [12] U.S. Environmental Protection Agency. How much can a radon mitigation system cost?. current guidance. Accessed 2026-11-02.
- [13] U.S. Environmental Protection Agency. Overview of EPA's State and Tribal Indoor Radon Grants Program: Activities Conducted During Fiscal Year 2025 (July 2026). October 1, 2024 to September 30, 2025. Accessed 2026-11-02.
- [14] Centers for Disease Control and Prevention. Testing Your Home for Radon (August 26, 2026). current guidance. Accessed 2026-11-02.
- [15] Centers for Disease Control and Prevention. Radon and Your Health (June 18, 2026). current guidance. Accessed 2026-11-02.
- [16] Minnesota Department of Health. Radon Mitigation Systems. current guidance. Accessed 2026-11-02.
- [17] Minnesota Department of Health. Radon in Homes. current. Accessed 2026-11-02.
- [18] Minnesota Office of the Revisor of Statutes. Minnesota Statutes 144.496, Minnesota Radon Awareness Act (2026 Minnesota Statutes). effective January 1, 2014. Accessed 2026-11-02.
- [19] Illinois Emergency Management Agency and Office of Homeland Security. Radon: Real Estate. current. Accessed 2026-11-02.
- [21] U.S. Environmental Protection Agency. The National Radon Action Plan: A Strategy for Saving Lives. NRAP 2021 to 2025. Accessed 2026-11-02.
- [22] U.S. Environmental Protection Agency. State and Tribal Indoor Radon Grants (SIRG) Program and Resources. FY2022 to 2026 strategic plan. Accessed 2026-11-02.
- [23] U.S. Environmental Protection Agency, Region 8. EPA encourages Rocky Mountain and Great Plains region residents to Test Your Nest. news release. Accessed 2026-11-02.
- [24] Centers for Disease Control and Prevention (CDCgov on GitHub). EPHTrackR: R package for the Tracking Network API (source code). current. Accessed 2026-11-02.
- [27] U.S. Environmental Protection Agency. How often should I test/retest my home for radon?. current guidance. Accessed 2026-11-02.
- [28] Illinois Emergency Management Agency and Office of Homeland Security. Radon (program page). current. Accessed 2026-11-02.
Tier 2: trade bodies, market research, company data (2)
- [20] Environmental Law Institute. Database of State Indoor Air Quality Laws, Database Excerpt: Radon Laws (Summer 2026, laws enacted through June 2026). through June 2026. Accessed 2026-11-02.
- [26] University of Georgia Extension Radon Program. Georgia Radon Map. tests 1990 to 2024. Accessed 2026-11-02.
Tier 3: journalism and expert commentary (1)
- [25] Mapscaping. US Radon Zones Map: Find High-Risk Counties by State (May 4, 2026). 2026. Accessed 2026-11-02.