
PFAS Map: 1,127 Water Systems Averaged Above EPA's PFOA or PFOS Limit
- Primary data
- EPA UCMR 5 occurrence data (UCMR5_All.txt), final release
- Data period
- Samples January 2023 to December 2025
- Latest release used
- 2026-10-15
- Next release
- None planned for UCMR 5 (final); UCMR 6 proposed July 2026
- Geography
- 50 states, DC, territories and Tribal systems
- Sources
- 21 (19 Tier 1)
In our PFAS map of EPA's final UCMR 5 data, 1,127 of 10,128 fully sampled water systems (11.1%), serving 54.3 million people, averaged above the 4.0 ng/L limit for PFOA or PFOS. Connecticut and New Jersey lead at about 44%. Utilities must comply by April 2029; EPA has proposed allowing 2031.
On the PFAS map, 44% of Connecticut and New Jersey water systems averaged above 4.0 ng/L
Across the 50 states and DC, 43 have at least one water system whose UCMR 5 sampling-point average for PFOA or PFOS was above EPA's 4.0 ng/L limit. The rate ranges from 44.4% of systems in Connecticut to zero in 8 jurisdictions.
UCMR 5, 2023 to 2025; % of systems with a full set of results
Source: EPA UCMR 5 occurrence data (final, 2026). KBR calculation.
Connecticut (28 of 63 systems, 44.4%) and New Jersey (114 of 258, 44.2%) have the highest shares of systems averaging above the PFOA or PFOS limit in EPA's 2023 to 2025 UCMR 5 sampling. The national share is 11.1%, so New Jersey's rate is 4.0 times the national figure. Delaware (33.3%), Florida (32.2%) and South Carolina (31.8%) follow.
Nine jurisdictions have shares of 20% or more, all of them eastern states. The median state share is 5.6%. Several large states sit far lower: Texas 2.4% (27 of 1,124 systems), Illinois 2.7% and Michigan 1.6%. No UCMR 5 system averaged above the limit in Arkansas, the District of Columbia, Hawaii, Iowa, Montana, North Dakota, Vermont and Wyoming.
Show all 53 rows
| State | Code | Systems tested | Systems with full set | Systems averaging above PFOA/PFOS limit | Share of full-set systems (%) | Population served by those systems | Share of full-set population (%) | Systems with any single PFOA/PFOS result >= 4.0 ng/L | Share of tested systems, single result (%) | Systems averaging above another 2024 limit |
|---|---|---|---|---|---|---|---|---|---|---|
| Connecticut | CT | 63 | 63 | 28 | 44.4 | 1167057 | 45.0 | 35 | 55.6 | 0 |
| New Jersey | NJ | 265 | 258 | 114 | 44.2 | 5121462 | 59.5 | 155 | 58.5 | 3 |
| Delaware | DE | 36 | 36 | 12 | 33.3 | 637206 | 66.8 | 14 | 38.9 | 1 |
| Florida | FL | 408 | 394 | 127 | 32.2 | 9737052 | 47.5 | 161 | 39.5 | 5 |
| South Carolina | SC | 165 | 154 | 49 | 31.8 | 2003882 | 47.4 | 67 | 40.6 | 8 |
| Massachusetts | MA | 263 | 260 | 75 | 28.8 | 1340006 | 18.9 | 109 | 41.4 | 2 |
| Rhode Island | RI | 29 | 29 | 8 | 27.6 | 220864 | 21.0 | 11 | 37.9 | 0 |
| North Carolina | NC | 289 | 277 | 68 | 24.5 | 2543113 | 29.3 | 117 | 40.5 | 4 |
| Pennsylvania | PA | 390 | 386 | 93 | 24.1 | 4253331 | 40.3 | 118 | 30.3 | 4 |
| California | CA | 705 | 685 | 129 | 18.8 | 8896750 | 23.2 | 168 | 23.8 | 12 |
| Alabama | AL | 307 | 302 | 56 | 18.5 | 1389708 | 23.0 | 82 | 26.7 | 0 |
| US territories (PR, GU, AS, MP, VI) | Territories | 110 | 109 | 20 | 18.3 | 1708976 | 50.7 | 31 | 28.2 | 2 |
| Maryland | MD | 83 | 82 | 15 | 18.3 | 163361 | 3.1 | 16 | 19.3 | 0 |
| New Hampshire | NH | 51 | 51 | 9 | 17.6 | 222708 | 30.4 | 16 | 31.4 | 0 |
| Arizona | AZ | 152 | 150 | 22 | 14.7 | 849512 | 12.5 | 25 | 16.4 | 4 |
| Ohio | OH | 347 | 343 | 37 | 10.8 | 1545169 | 15.7 | 60 | 17.3 | 1 |
| Georgia | GA | 256 | 253 | 27 | 10.7 | 1261810 | 12.9 | 45 | 17.6 | 1 |
| West Virginia | WV | 103 | 103 | 11 | 10.7 | 104848 | 8.6 | 21 | 20.4 | 1 |
| New York | NY | 334 | 329 | 32 | 9.7 | 1908026 | 11.4 | 50 | 15.0 | 2 |
| Wisconsin | WI | 202 | 202 | 19 | 9.4 | 185042 | 4.9 | 21 | 10.4 | 3 |
| Washington | WA | 248 | 246 | 20 | 8.1 | 1176316 | 13.3 | 35 | 14.1 | 3 |
| Oregon | OR | 127 | 127 | 10 | 7.9 | 226333 | 6.6 | 11 | 8.7 | 1 |
| Virginia | VA | 171 | 167 | 13 | 7.8 | 1762533 | 25.1 | 20 | 11.7 | 0 |
| Alaska | AK | 30 | 28 | 2 | 7.1 | 226251 | 42.3 | 4 | 13.3 | 1 |
| Tennessee | TN | 277 | 273 | 17 | 6.2 | 344152 | 4.7 | 37 | 13.4 | 1 |
| Nebraska | NE | 53 | 53 | 3 | 5.7 | 83158 | 5.8 | 4 | 7.5 | 0 |
| Nevada | NV | 59 | 54 | 3 | 5.6 | 488064 | 15.3 | 4 | 6.8 | 1 |
| Minnesota | MN | 196 | 196 | 10 | 5.1 | 270387 | 6.4 | 16 | 8.2 | 3 |
| Oklahoma | OK | 166 | 160 | 8 | 5.0 | 250611 | 8.4 | 13 | 7.8 | 1 |
| Maine | ME | 41 | 40 | 2 | 5.0 | 22328 | 4.2 | 5 | 12.2 | 0 |
| Kentucky | KY | 231 | 230 | 9 | 3.9 | 199762 | 4.2 | 30 | 13.0 | 0 |
| Idaho | ID | 61 | 61 | 2 | 3.3 | 21500 | 1.6 | 3 | 4.9 | 2 |
| Kansas | KS | 103 | 103 | 3 | 2.9 | 77468 | 3.3 | 6 | 5.8 | 2 |
| Illinois | IL | 487 | 485 | 13 | 2.7 | 353817 | 3.2 | 28 | 5.7 | 1 |
| Indiana | IN | 230 | 229 | 6 | 2.6 | 166389 | 3.5 | 21 | 9.1 | 1 |
| Missouri | MO | 232 | 229 | 6 | 2.6 | 73399 | 1.5 | 9 | 3.9 | 0 |
| Tribal systems (EPA regions, Navajo Nation) | Tribal | 115 | 114 | 3 | 2.6 | 43454 | 4.9 | 6 | 5.2 | 0 |
| Colorado | CO | 165 | 162 | 4 | 2.5 | 101207 | 1.6 | 15 | 9.1 | 1 |
| Texas | TX | 1154 | 1124 | 27 | 2.4 | 2837447 | 9.5 | 106 | 9.2 | 10 |
| Mississippi | MS | 239 | 234 | 5 | 2.1 | 84633 | 3.7 | 7 | 2.9 | 0 |
| South Dakota | SD | 49 | 49 | 1 | 2.0 | 4100 | 0.6 | 2 | 4.1 | 1 |
| Michigan | MI | 319 | 319 | 5 | 1.6 | 219330 | 3.2 | 8 | 2.5 | 1 |
| Utah | UT | 129 | 129 | 2 | 1.6 | 14975 | 0.4 | 4 | 3.1 | 1 |
| New Mexico | NM | 73 | 72 | 1 | 1.4 | 2286 | 0.1 | 4 | 5.5 | 0 |
| Louisiana | LA | 268 | 261 | 1 | 0.4 | 6354 | 0.1 | 7 | 2.6 | 0 |
| Arkansas | AR | 172 | 170 | 0 | 0.0 | 0 | 0.0 | 1 | 0.6 | 0 |
| District of Columbia | DC | 3 | 3 | 0 | 0.0 | 0 | 0.0 | 0 | 0.0 | 0 |
| Hawaii | HI | 45 | 45 | 0 | 0.0 | 0 | 0.0 | 0 | 0.0 | 0 |
| Iowa | IA | 152 | 147 | 0 | 0.0 | 0 | 0.0 | 7 | 4.6 | 1 |
| Montana | MT | 45 | 44 | 0 | 0.0 | 0 | 0.0 | 2 | 4.4 | 0 |
| North Dakota | ND | 38 | 37 | 0 | 0.0 | 0 | 0.0 | 0 | 0.0 | 0 |
| Vermont | VT | 38 | 38 | 0 | 0.0 | 0 | 0.0 | 1 | 2.6 | 0 |
| Wyoming | WY | 33 | 33 | 0 | 0.0 | 0 | 0.0 | 1 | 3.0 | 1 |
KBR calculation from EPA UCMR5_All.txt (final, October 2026 file) and ECHO SDWIS population (2026 Q3). Average = mean of a sampling point's full set of results, results below 4 ng/L counted as 0; above = 0.00405 ug/L or more (EPA's cutoff). 'Another 2024 limit' = PFHxS, PFNA, HFPO-DA or Hazard Index.
54.3 million people get water from a system that averaged above the PFOA or PFOS limit
Matching each UCMR 5 system to its population in EPA's SDWIS file (2026 Q3) gives 54,316,137 people served by systems with an above-limit average, 18.1% of the 300.2 million served by all fully sampled systems.
Florida (9.74 million), California (8.9 million) and New Jersey (5.12 million) account for 43.7% of the 54.3 million. 111 of the 1,127 systems serve 100,000 people or more.
Top 15 states, millions of people, UCMR 5 2023 to 2025
Source: EPA UCMR 5; EPA ECHO SDWIS population (2026 Q3). KBR calculation.
The largest system on the list is MDWASA – MAIN SYSTEM (FL), serving 2,377,460 people, with a highest sampling-point average of 31.4 ng/L PFOS. A system is counted when any one of its sampling points averaged above the limit, so the population figure is an upper bound on the people actually drinking water above 4.0 ng/L.
| Water system (EPA name) | PWSID | State | Population served (SDWIS, 2026 Q3) | Highest sampling-point average PFOA (ng/L) | Highest sampling-point average PFOS (ng/L) |
|---|---|---|---|---|---|
| MDWASA – MAIN SYSTEM | FL4130871 | FL | 2377460 | 12.3 | 31.4 |
| PHILADELPHIA WATER DEPARTMENT | PA1510001 | PA | 1600000 | 7.4 | 5.0 |
| FAIRFAX COUNTY WATER AUTHORITY | VA6059501 | VA | 1121613 | 4.6 | 2.6 |
| SUFFOLK COUNTY WATER AUTHORITY | NY5110526 | NY | 1100000 | 6.0 | 12.1 |
| METROPOLITANO | PR0002591 | PR | 1084637 | 2.7 | 6.2 |
| CITY OF FORT WORTH | TX2200012 | TX | 955900 | 5.9 | 6.2 |
| AQUA PA MAIN SYSTEM | PA1460073 | PA | 822600 | 11.8 | 8.9 |
| CINCINNATI PUBLIC WATER SYSTEM | OH3102612 | OH | 800000 | 0.0 | 5.2 |
| SUEZ WATER NEW JERSEY HACKENSACK | NJ0238001 | NJ | 792713 | 13.0 | 6.3 |
| EL PASO WATER UTILITIES PUBLIC SERVICE B | TX0710002 | TX | 747168 | 0.0 | 6.4 |
| CITY OF TAMPA WATER DEPARTMENT | FL6290327 | FL | 733886 | 2.3 | 5.7 |
| PALM BEACH COUNTY WATER UTILITIES | FL4504393 | FL | 671114 | 8.1 | 19.0 |
| NJ AMERICAN WATER – RARITAN | NJ2004002 | NJ | 615430 | 6.6 | 6.0 |
| CITY OF FRESNO | CA1010007 | CA | 545970 | 13.5 | 21.5 |
| CITY OF SACRAMENTO MAIN | CA3410020 | CA | 527979 | 16.4 | 38.8 |
Highest average across the system's sampling points; other points may be lower. Not a compliance finding. Names as recorded by EPA.
For a homeowner, the system name and PWSID on the water bill or in the annual water quality report (Consumer Confidence Report) are the link to these results. EPA's UCMR occurrence data page lists every result by system.
One sample at 4 ng/L is not a violation: 1,739 systems hit it once, 1,127 on average
Because UCMR 5 could only report PFOA and PFOS at 4 ng/L or higher, every reported value is at or above the limit. 1,739 systems (16.9% of 10,307 tested) had at least one such result; 612 of them did not average above the limit once all samples were counted, or lacked a full set.
Systems flagged for PFOA or PFOS, UCMR 5
Source: EPA UCMR 5 occurrence data (final, 2026). KBR calculation.
Compliance under the 2024 rule is judged on a running annual average of quarterly results at each sampling point, not on a single sample. UCMR 5 collected two samples a year at ground water points and four at surface water points, so EPA averaged those and counted an average as above the PFOA or PFOS limit at 0.00405 ug/L or more.
Our reproduction of EPA's method matches the agency's published counts exactly: 662 of 4,277 large systems and 474 of 5,852 smaller systems averaged above at least one 2024 standard. EPA's weighted national estimate, which corrects for the partial small-system sample, is 7.8% of all US public water systems.
| System size | KBR: systems with full set | KBR: systems averaging above any 2024 limit | KBR share (%) | EPA Table 4: systems with full set | EPA Table 4: systems above | Check |
|---|---|---|---|---|---|---|
| Large (more than 10,000 people) | 4277 | 662 | 15.5 | 4277 | 662 | match |
| Small and medium (10,000 or fewer) | 5852 | 474 | 8.1 | 5852 | 474 | match |
EPA Table 4 of the July 2026 Data Summary splits smaller systems into medium (419 of 5,077) and small (55 of 775).
EPA comparison of UCMR 5 averages with 2024 MCLs
Source: EPA UCMR 5 Data Summary, July 2026, Table 4.
If EPA drops four of the six standards, 9 systems leave the above-limit list
Of the 1,136 systems that averaged above any 2024 standard, only 9 (0.8%) were above solely the PFHxS, PFNA, HFPO-DA or Hazard Index standards that EPA proposed to rescind on May 20, 2026.
Systems with a sampling-point average above the MCL
Source: EPA UCMR 5 occurrence data (final, 2026). KBR calculation.
PFOS (875 systems) and PFOA (779) drive almost every case. The Hazard Index mixture (80), PFHxS (66), PFNA (9) and HFPO-DA (8) average above their limits far less often, and 77 of the 86 systems above one of them were also above for PFOA or PFOS. The 9 systems above only a proposed-rescission standard serve 0.14 million people.
| Standard | 2024 MCL | Systems with full set | Systems averaging above | Share (%) | Status on 2026-11-02 |
|---|---|---|---|---|---|
| PFOS | 4.0 ng/L | 10127 | 875 | 8.64 | Kept; EPA proposed optional extension to April 26, 2031 |
| PFOA | 4.0 ng/L | 10128 | 779 | 7.69 | Kept; EPA proposed optional extension to April 26, 2031 |
| Hazard Index mixture | Hazard Index 1 | 10123 | 80 | 0.79 | Proposed for rescission (May 2026) |
| PFHxS | 10 ng/L | 10125 | 66 | 0.65 | Proposed for rescission (May 2026) |
| PFNA | 10 ng/L | 10128 | 9 | 0.09 | Proposed for rescission (May 2026) |
| HFPO-DA (GenX) | 10 ng/L | 10129 | 8 | 0.08 | Proposed for rescission (May 2026) |
A system above several standards is counted once in each row.
Source: [1][2][7][8] U.S. EPA; U.S. EPA; U.S. EPA, Federal Register; U.S. EPA, Federal Register
These counts are UCMR 5 screening results. They show how much of the measured problem the rescission would remove from federal requirements; they do not show the health effect of the change, which EPA did not reopen for comment in the rescission proposal.
When do water utilities have to meet the PFAS limits? April 2029 in law, 2031 if EPA finalizes its proposal
The 2024 rule took effect June 25, 2024. Initial monitoring is due April 26, 2027 and the limits apply from April 26, 2029. A May 2026 proposal would let systems request until April 26, 2031 for PFOA and PFOS; as of 2026-11-02 we found no final rule in the Federal Register.
| Date | Event | Record | Source id |
|---|---|---|---|
| 2021-12-27 | UCMR 5 published: 29 PFAS plus lithium, sampling 2023 to 2025 | 86 FR 73131 | |
| 2024-04-10 | EPA announces final PFAS drinking water rule (six PFAS) | EPA rule page | |
| 2024-04-26 | Final rule published; PFOA and PFOS MCLs 4.0 ng/L | 89 FR 32532 | |
| 2024-06-07 | Utility and industry groups file challenge, AWWA v. EPA, No. 24-1188 (D.C. Cir.) | Harvard EELP tracker | |
| 2024-06-25 | Rule takes effect | 89 FR 32532; 89 FR 49101 | |
| 2025-05-14 | EPA says it will keep PFOA and PFOS limits, extend compliance to 2031, rescind the other four | EPA news release | |
| 2025-09-11 | EPA asks the court to vacate the four non-PFOA/PFOS standards | Harvard EELP tracker | |
| 2026-01-12 | D.C. Circuit denies summary vacatur; all six limits stay in place | Harvard EELP tracker | |
| 2026-03-19 | D.C. Circuit denies EPA request to sever and pause the four-PFAS claims | Harvard EELP tracker | |
| 2026-05-20 | Two proposals published: optional PFOA/PFOS extension to 2031; rescission of four standards | 91 FR 29425; 91 FR 29413 | |
| 2026-07-20 | Comment periods on both proposals close | 91 FR 29425; 91 FR 29413 | |
| 2026-08 | EPA releases final UCMR 5 dataset | EPA UCMR 5 page | |
| 2027-04-26 | Initial monitoring deadline under the 2024 rule | 89 FR 32532 | |
| 2029-04-26 | PFOA/PFOS compliance date in the 2024 rule | 89 FR 32532 | |
| 2031-04-26 | Proposed extended PFOA/PFOS date for systems that request it (not final) | 91 FR 29425 |
Dates after 2026-11-02 are deadlines in current or proposed rules.
Source: [5][7][8][9][16][18][19] U.S. EPA, Federal Register; U.S. EPA, Federal Register; U.S. EPA, Federal Register; U.S. EPA; U.S. EPA, Federal Register; U.S. EPA; Harvard Law School Environmental and Energy Law Program
The legal challenge, American Water Works Association v. EPA, No. 24-1188, is pending in the D.C. Circuit. The court denied EPA's request to summarily vacate the four non-PFOA/PFOS standards in January 2026 and denied its request to sever and pause those claims on March 19, 2026 (Harvard EELP tracker). With that ruling, all six limits stay in place until a merits decision or a final rescission (MG+M). We found no merits decision as of 2026-11-02.
The April 2024 rule set the PFOA and PFOS health goals at zero and the enforceable limits at 4.0 ng/L; it set 10 ng/L for PFHxS, PFNA and HFPO-DA and a Hazard Index of 1 for mixtures (89 FR 32532). EPA estimated compliance costs and quantified health benefits at about $1.5 billion a year each (EPA fact sheet).
Filters certified to NSF/ANSI 53 or 58 reduce PFAS, but no label yet promises 4 ng/L
EPA tells consumers to look for certification to NSF/ANSI 53 or NSF/ANSI 58 for PFAS reduction, and notes that certifications as of April 2024 do not show removal down to the new limits.
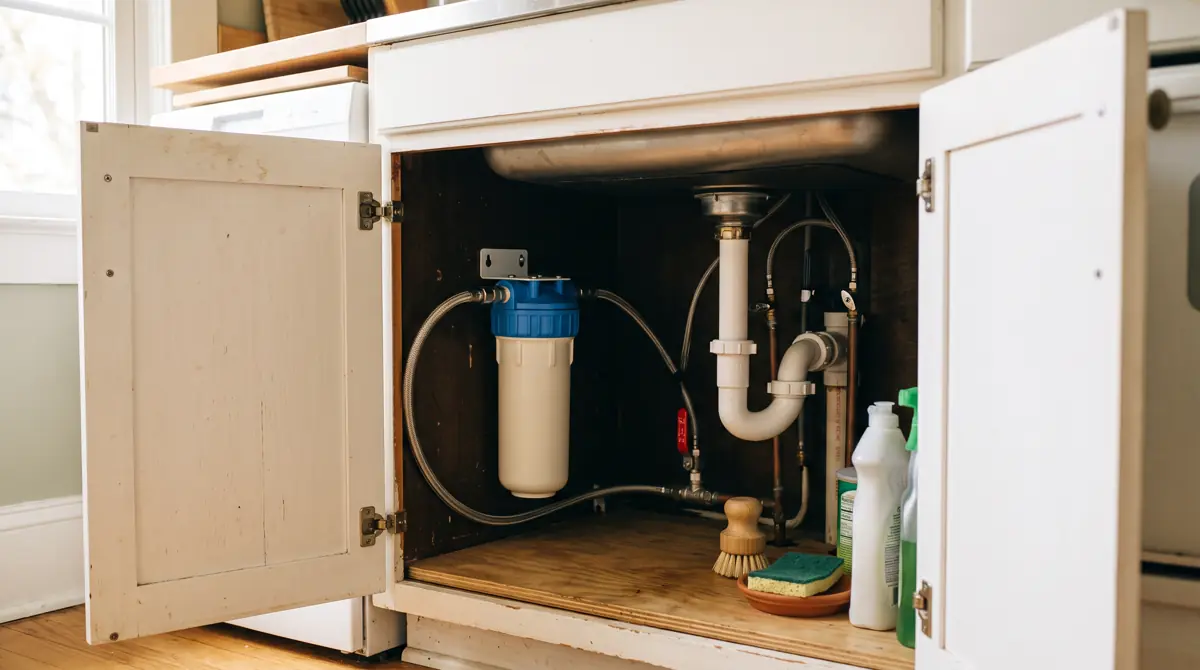
EPA names three point-of-use technologies that can reduce PFAS: activated carbon, ion exchange resin and reverse osmosis. Its April 2024 fact sheet prices home filters from $20 to more than $1,000 before maintenance, and lists 5 ANSI-accredited bodies that certify filters for PFAS reduction (EPA home filter fact sheet; EPA filter page).
Filters only work while cartridges and membranes are replaced on the maker's schedule. An under-sink reverse osmosis unit also needs a drain connection and cabinet space, which is easier to plan during a kitchen remodel; see our kitchen remodel timeline for where plumbing rough-in falls. Mineral scale is a separate question covered in our hard water map.

What EPA and ATSDR link to PFAS exposure
EPA lists 6 groups of health outcomes linked to exposure to certain PFAS, from some cancers to immune and cholesterol effects; ATSDR says research on mixtures and low-level exposure is ongoing.
- Reproductive effects, including decreased fertility and higher blood pressure in pregnancy (EPA).
- Developmental effects in children, including low birth weight and accelerated puberty (EPA).
- Increased risk of some cancers, including prostate, kidney and testicular cancers (EPA); kidney and testicular cancer associated with PFOA (ATSDR).
- Reduced immune response, including lower antibody response to some vaccines (EPA, ATSDR).
- Interference with the body's hormones (EPA).
- Higher cholesterol and/or obesity risk (EPA); cholesterol increases associated with PFOA, PFOS, PFNA and PFDA (ATSDR).
Sources: EPA, updated October 30, 2026; ATSDR. Both agencies say risk depends on dose, duration and individual factors. Our lead service line counts are in the separate lead pipes map.
State-by-state findings
- 1,127 of 10,128 UCMR 5 systems (11.1%) averaged above 4.0 ng/L for PFOA or PFOS at one or more sampling points, 2023 to 2025, United States.[1][2]
- Systems averaging above the PFOA or PFOS limit serve 54,316,137 people (SDWIS, 2026 Q3).[1][4]
- Connecticut has the highest share of systems above the limit, 44.4% (28 of 63), UCMR 5 2023 to 2025.[1]
- New Jersey has 114 systems above the limit, 44.2% of its 258 fully sampled systems, serving 5.12 million people.[1][4]
- Florida has the most people served by above-limit systems, 9.74 million, UCMR 5 2023 to 2025.[1][4]
- 43 of 51 jurisdictions (50 states and DC) have at least one system averaging above the PFOA or PFOS limit.[1]
- PFOS averaged above its limit in 875 systems and PFOA in 779, UCMR 5 2023 to 2025.[1][2]
- EPA reports 15.5% of large, 8.3% of medium and 7.1% of small UCMR 5 systems averaged above at least one 2024 PFAS limit.[2]
- EPA's weighted estimate is that 7.8% of all US public water systems would have an average above a 2024 PFAS limit.[2]
- 66% of UCMR 5 sampling locations with any PFAS at or above the reporting level had more than one PFAS (EPA, July 2026).[2]
- 9 systems (0.8% of 1,136) were above only standards EPA proposed to rescind on May 20, 2026.[1][8]
- The 2024 rule's PFOA and PFOS compliance date is April 26, 2029; EPA proposed April 26, 2031 for systems that request it.[5][7]
- EPA says certifications as of April 2024 do not show that a home filter removes PFAS down to the new limits.[11][12]
Rankings and ratios we derived
Signature: systems and people above the PFOA/PFOS limit, by state
Formulacount of systems with any sampling-point full-set average >= 0.00405 ug/L for PFOA or PFOS (results < MRL = 0) / systems with a full set; population = sum of SDWIS POPULATION_SERVED_COUNT for those systems
Inputs: fact sheet rows 35, 36, 40, 46, 49; derived d1, d1b, d3; raw UCMR5_All.txt; raw SDWA_PUB_WATER_SYSTEMS.csv (fact sheet rows)
Result: 1,127 of 10,128 systems (11.1%), 54,316,137 people; Connecticut 44.4%, New Jersey 44.2%
EPA publishes this comparison nationally by size; the state split and the population served are our additions.
Limitations: Screening comparison, not compliance; population counts the whole system if any one sampling point averaged above.
Reproduction check against EPA Table 4
Formulasame method applied to all six standards, split by EPA size code
Inputs: fact sheet rows 29, 30, 31; tables/t2_epa_reproduction.csv (fact sheet rows)
Result: 662 of 4,277 large and 474 of 5,852 smaller systems, identical to EPA's counts
The state numbers are built on the same rules EPA used, so they can be summed back to EPA's totals.
Limitations: We use EPA's size flag (S/L), not SDWIS population, to split sizes.
Single-sample screen versus EPA-method average
Formulasystems with any PFOA or PFOS result reported (MRL = 4 ng/L) minus systems with an average above
Inputs: fact sheet rows 35, 49; derived d5, d1, d15 (fact sheet rows)
Result: 1,739 versus 1,127; a gap of 612 systems
Maps that flag any single detection count roughly half again as many systems as an average-based comparison.
Limitations: Neither is the four-quarter running annual average the rule uses.
Exposure of the above-limit list to the proposed rescission
Formulasystems above any of six standards minus systems above PFOA or PFOS
Inputs: fact sheet rows 18, 37, 38; derived d6, d1, d8, d8c (fact sheet rows)
Result: 9 of 1,136 systems (0.8%), serving 0.14 million people
Nearly every system above a 2024 limit stays above one under the PFOA/PFOS-only rule EPA proposes.
Limitations: Says nothing about health risk from PFHxS, PFNA, HFPO-DA or mixtures below the averaging cutoffs.
Population concentration
Formulasum of population served above the limit in the top 3 states / national population served above
Inputs: tables/t1_state_atlas.csv; derived d3, d12 (fact sheet rows)
Result: 43.7% in Florida, California and New Jersey
A few large coastal utilities carry much of the population figure.
Limitations: Driven by a handful of very large systems, such as the largest Florida system in table t4.
Executive summary
- 1,127 of 10,128 UCMR 5 water systems (11.1%) had a sampling-point average above EPA's 4.0 ng/L limit for PFOA or PFOS in 2023 to 2025 sampling.
- Those systems serve 54.3 million people, 18.1% of the population served by all fully sampled systems.
- Connecticut (44.4%) and New Jersey (44.2%) have the highest state shares; 8 jurisdictions had none.
- Florida, California and New Jersey hold 43.7% of the people served by above-limit systems.
- A single-sample screen flags 1,739 systems; averaging, as EPA does, cuts that to 1,127.
- Only 9 systems exceed solely the PFHxS, PFNA, HFPO-DA or Hazard Index standards EPA proposed to rescind in May 2026.
- The 2024 rule requires compliance by April 26, 2029; EPA's May 2026 proposal would let systems request April 26, 2031. Neither proposal was final on 2026-11-02.
Questions people ask
Is there PFAS in my tap water?
If your utility took part in UCMR 5, its results are public: 10,307 systems reported PFOA results and 1,739 had at least one PFOA or PFOS result of 4 ng/L or more. Find your system name and PWSID on your water bill or annual water quality report, then look it up in EPA's UCMR 5 Data Finder. Private wells were not tested.
Do water filters remove PFAS?
EPA says carbon, ion exchange and reverse osmosis point-of-use filters can greatly reduce PFAS when maintained. Look for NSF/ANSI 53 or 58 certification for PFAS reduction. EPA adds that certifications as of April 2024 do not yet show removal down to 4.0 ng/L. Prices run from $20 to more than $1,000.
What are the health effects of PFAS?
EPA lists reproductive and developmental effects, increased risk of some cancers (prostate, kidney, testicular), reduced immune response, hormone interference and higher cholesterol or obesity risk. ATSDR notes research on low-level and mixture exposure is ongoing. This is not medical advice.
When do water utilities have to meet the PFAS limits?
Under the April 2024 rule, by April 26, 2029, with initial monitoring due April 26, 2027. EPA proposed on May 20, 2026 to let systems request until April 26, 2031 for PFOA and PFOS, and to drop the other four standards. Neither proposal was final as of 2026-11-02.
Download the data
Every table in this report is available as a CSV under CC BY 4.0. The fact sheet lists each value with its source URL and access date.
- derived_metrics.csv (CSV)
- fact_sheet.csv (CSV)
- t1_state_atlas.csv (CSV)
- t2_epa_reproduction.csv (CSV)
- t3_by_pfas.csv (CSV)
- t4_largest_systems.csv (CSV)
- t5_timeline.csv (CSV)
For journalists and researchers
If you cite only a few, cite these
- 1,127 of 10,128 water systems (11.1%) averaged above 4.0 ng/L for PFOA or PFOS (EPA UCMR 5, 2023 to 2025; KBR calculation).[1]
- Those systems serve 54.3 million people (EPA SDWIS, 2026 Q3).[4]
- Connecticut (44.4%) and New Jersey (44.2%) have the highest shares.[1]
Most quotable statistics
- 1,127 US water systems serving 54.3 million people averaged above EPA's 4.0 ng/L PFOA or PFOS limit in 2023 to 2025 testing.[1][4]
- 44.4% of Connecticut's UCMR 5 water systems averaged above the PFOA or PFOS limit, the highest state share.[1]
- Only 9 of 1,136 above-limit systems would leave the list if EPA rescinds the four non-PFOA/PFOS standards.[1][8]
- Florida, California and New Jersey hold 43.7% of the people served by water systems above the PFOA or PFOS limit.[1][4]
- EPA estimates 7.8% of all US public water systems have an average above a 2024 PFAS limit.[2]
- EPA proposed moving the PFOA and PFOS compliance date from April 26, 2029 to April 26, 2031 for systems that ask.[7]
Press summary
A Kitchen and Bath Renovators analysis of EPA's final UCMR 5 drinking water data finds that 1,127 of 10,128 public water systems (11.1%) had a sampling-point average above the federal 4.0 ng/L limit for PFOA or PFOS in 2023 to 2025 testing. Those systems serve 54.3 million people, based on EPA's 2026 Q3 population records. Connecticut (44.4%) and New Jersey (44.2%) have the highest shares of systems above the limit; Florida has the most people served by them, 9.74 million. The analysis reproduces EPA's own national counts exactly before splitting them by state. Only 9 of 1,136 systems above any 2024 standard exceed solely the four standards EPA proposed to rescind in May 2026. UCMR 5 results are not compliance findings: utilities must meet the limits by April 26, 2029 under the 2024 rule, and EPA has proposed allowing April 26, 2031 for systems that request it. Neither proposal was final as of November 2, 2026.
Suggested headlines
- PFAS map: 1,127 water systems serving 54.3 million people averaged above EPA's PFOA or PFOS limit
- 44.4% of Connecticut water systems averaged above the federal PFAS limit
- Florida leads in people served by water systems above the PFOA or PFOS limit: 9.74 million
- EPA's proposed PFAS rollback would remove only 9 systems from the above-limit list
- PFAS limits still due in 2029 as EPA's 2031 extension remains a proposal
How to cite this report
Kitchen and Bath Renovators. (2026). PFAS Map: 1,127 Water Systems Averaged Above EPA's PFOA or PFOS Limit. Retrieved from https://kitchenandbathrenovators.com/research/pfas-map/
Reuse license
Data and tables are licensed CC BY 4.0. Attribution: “Source: Kitchen and Bath Renovators, PFAS Map: 1,127 Water Systems Averaged Above EPA's PFOA or PFOS Limit” with a link to this page.
Frequently asked questions
What is the PFOA and PFOS limit in drinking water?
4.0 ng/L (parts per trillion) each, set in EPA's April 26, 2024 rule, with a health goal of zero.
How many water systems were above the PFAS limit?
1,127 of 10,128 UCMR 5 systems (11.1%) averaged above 4.0 ng/L for PFOA or PFOS at a sampling point in 2023 to 2025; 1,136 were above any of the six 2024 standards.
Which state has the most PFAS in drinking water?
By share of systems, Connecticut (44.4%) and New Jersey (44.2%). By people served, Florida (9.74 million).
Is a UCMR 5 detection a violation?
No. EPA states UCMR 5 results do not indicate compliance or noncompliance; compliance is based on running annual averages of quarterly samples starting in 2029.
How many people drink water from systems above the limit?
Systems averaging above the PFOA or PFOS limit serve 54.3 million people, an upper bound because some of their sampling points were below.
Did EPA drop the PFAS drinking water rule?
No. EPA kept the PFOA and PFOS limits and on May 20, 2026 proposed rescinding the PFHxS, PFNA, HFPO-DA and Hazard Index standards. Those remain in effect until a final rule or court ruling.
What did the court decide in the PFAS rule lawsuit?
As of 2026-11-02 we found no merits decision in AWWA v. EPA, No. 24-1188. The D.C. Circuit denied EPA's vacatur request in January 2026 and its severance request on March 19, 2026.
How many PFAS did UCMR 5 test for?
29 PFAS plus lithium, sampled from 2023 to 2025 at every system serving more than 10,000 people, systems serving 3,300 to 10,000, and a representative sample of smaller systems.
How common are PFAS mixtures in tap water?
66% of sampling locations with any PFAS at or above the reporting level had more than one, and one location had 13 different PFAS (EPA, July 2026).
Does a home filter bring PFAS below 4 ng/L?
Not guaranteed. EPA says certifications as of April 2024 do not show removal down to the new limits, though certified filters reduce PFAS.
Reproduce this analysis
Every figure comes from the files below. The scripts that pulled and computed them are kept with the report and can be re-run.
| Dataset | Publisher | Source | Query or filter | Rows used | Retrieved |
|---|---|---|---|---|---|
| UCMR 5 Occurrence Data Text Files (UCMR5_All.txt) | U.S. EPA | File or endpoint | Contaminant in PFOA, PFOS, PFHxS, PFNA, HFPO-DA, PFBS; all states; AnalyticalResultsSign '<' set to 0 | 10,307 systems with PFOA/PFOS results; 10,128 with a full set | 2026-11-02 |
| ECHO SDWA public water systems (SDWA_PUB_WATER_SYSTEMS.csv) | U.S. EPA ECHO | File or endpoint | PWSID join to UCMR 5; POPULATION_SERVED_COUNT; submission quarter 2026Q3 | 10,307 of 10,307 UCMR 5 systems matched | 2026-11-02 |
| Federal Register documents API | Office of the Federal Register | File or endpoint | EPA documents matching 'PFAS National Primary Drinking Water Regulation' (all dates) and 'PFOA PFOS drinking water' published 2026-05-21 or later | 19 and 2 documents returned; 6 used | 2026-11-02 |
Data quality and exclusions
- Kept only PFOA, PFOS, PFHxS, PFNA, HFPO-DA and PFBS rows from the 30-contaminant file; the other 23 PFAS and lithium were dropped from the state table.
- 179 tested systems had no sampling point with a full set of PFOA or PFOS results and are excluded from the average-based shares, as EPA does.
- 13 systems have a population of 0 in SDWIS and add nothing to population totals.
- Duplicate results for the same sampling point, event and contaminant were collapsed by keeping the higher value.
- 115 Tribal systems (EPA region codes and Navajo Nation) and 110 territory systems are reported as separate rows and excluded from the tile map.
Methodology
Selection: the primary dataset is EPA's UCMR 5 occurrence file (UCMR5_All.txt in ucmr5-occurrence-data.zip, file dated 2026-10-15), the final release covering samples from January 2023 to December 2025. Population served comes from EPA's ECHO SDWA download (SDWA_PUB_WATER_SYSTEMS.csv, submission quarter 2026Q3). Regulatory dates come from the Federal Register and EPA pages. Litigation events come from the Harvard EELP tracker, with a law firm note as support.
Inclusion: all rows for PFOA, PFOS, PFHxS, PFNA, HFPO-DA and PFBS. A system counts as tested if it has any PFOA or PFOS result. A sampling point has a full set when it has 2 results (ground water) or 4 results (surface water, ground water under surface influence, or mixed). Results reported as below the reporting level are set to 0.
Averages and cutoffs follow EPA's July 2026 Data Summary: an average counts as above the PFOA or PFOS limit at 0.00405 ug/L or more, above PFHxS, PFNA or HFPO-DA at 0.015 ug/L or more, and above the Hazard Index at 1.5 or more with at least two of the four PFAS at or above the reporting level. Hazard Index values are computed per sample event, then averaged. These rules reproduce EPA's Table 4 counts exactly (table t2).
Conflicts: EPA says UCMR 5 results do not indicate compliance; we report them as a screening comparison. Where two sources date the same court order differently (January 12 versus January 20, 2026), we use the tracker date and note the other in the fact sheet. Tribal systems without primacy and territories are reported as separate rows and are not drawn on the state map.
Derived metrics are in derived_metrics.csv with formulas and inputs; scripts/build_data.py recomputes everything from raw files. Last updated 2026-11-02.
This report presents published data with its limitations. It is not legal, financial or investment advice.
Sources, ranked by quality
Tier 1: primary and official sources (19)
- [1] U.S. EPA. UCMR 5 Occurrence Data Text Files (UCMR5_All.txt, file dated 2026-10-15). Samples 2023 to 2025; final release August 2026. Accessed 2026-11-02.
- [2] U.S. EPA. The Fifth Unregulated Contaminant Monitoring Rule (UCMR 5) Data Summary: July 2026 (EPA 815-S-26-007). 2023 to 2025. Accessed 2026-11-02.
- [3] U.S. EPA. Occurrence Data from the Unregulated Contaminant Monitoring Rule (web page, updated October 15, 2026). 2023 to 2025. Accessed 2026-11-02.
- [4] U.S. EPA ECHO. ECHO SDWA data download: SDWA_PUB_WATER_SYSTEMS.csv (submission quarter 2026Q3). 2026 Q3. Accessed 2026-11-02.
- [5] U.S. EPA, Federal Register. PFAS National Primary Drinking Water Regulation, 89 FR 32532 (April 26, 2024). 2024. Accessed 2026-11-02.
- [6] U.S. EPA, Federal Register. PFAS National Primary Drinking Water Regulation; Correction, 89 FR 49101 (June 11, 2024). 2024. Accessed 2026-11-02.
- [7] U.S. EPA, Federal Register. Extending the Compliance Deadline for the PFOA and PFOS Maximum Contaminant Levels, 91 FR 29425 (May 20, 2026). 2026. Accessed 2026-11-02.
- [8] U.S. EPA, Federal Register. Rescission of Regulatory Determinations and Removal of Related Provisions for Four PFAS Substances, 91 FR 29413 (May 20, 2026). 2026. Accessed 2026-11-02.
- [9] U.S. EPA. EPA Announces It Will Keep Maximum Contaminant Levels for PFOA, PFOS (news release, May 14, 2025). 2025. Accessed 2026-11-02.
- [10] U.S. EPA. Final PFAS National Primary Drinking Water Regulation (web page, updated May 18, 2026). 2024 to 2026. Accessed 2026-11-02.
- [11] U.S. EPA. Identifying Drinking Water Filters Certified to Reduce PFAS (web page, updated November 18, 2025). 2024 to 2025. Accessed 2026-11-02.
- [12] U.S. EPA. Fact Sheet: Reducing PFAS in Your Drinking Water with a Home Filter (April 2024). 2024. Accessed 2026-11-02.
- [13] U.S. EPA. Fact Sheet: PFAS National Primary Drinking Water Regulation (April 2024). 2024. Accessed 2026-11-02.
- [14] U.S. EPA. Our Current Understanding of the Human Health and Environmental Risks of PFAS (web page, updated October 30, 2026). 2026. Accessed 2026-11-02.
- [15] CDC Agency for Toxic Substances and Disease Registry. PFAS: Potential Health Effects of PFAS Chemicals. current page. Accessed 2026-11-02.
- [16] U.S. EPA, Federal Register. Revisions to the Unregulated Contaminant Monitoring Rule (UCMR 5), 86 FR 73131 (December 27, 2021). 2021. Accessed 2026-11-02.
- [17] U.S. EPA, Federal Register. Revisions To Establish the Sixth Unregulated Contaminant Monitoring Rule (UCMR 6), 91 FR 39952 (July 1, 2026). 2026. Accessed 2026-11-02.
- [18] U.S. EPA. Fifth Unregulated Contaminant Monitoring Rule (web page, updated August 28, 2026). 2021 to 2026. Accessed 2026-11-02.
- [21] Office of the Federal Register. Federal Register API search: EPA documents matching PFOA PFOS drinking water, published 2026-05-21 to 2026-11-02. 2026-05-21 to 2026-11-02. Accessed 2026-11-02.
Tier 2: trade bodies, market research, company data (1)
- [19] Harvard Law School Environmental and Energy Law Program. Regulatory Tracker: PFAS in Drinking Water. 2024 to 2026. Accessed 2026-11-02.
Tier 3: journalism and expert commentary (1)
- [20] MG+M The Law Firm. DC Panel Puts the Brakes on EPA's Attempt to Undo PFAS MCLs. January 2026. Accessed 2026-11-02.