Kitchen Fires: US Home Cooking Fire Statistics and Trends (2026 Tracker)
- Primary data
- USFA residential fire estimates; NFIRS Public Data Release 2023 to 2025; CPSC NEISS 2024 and 2025
- Data period
- 2014 to 2025
- Latest release used
- 2026-05-01
- Next release
- USFA national estimates for 2024 not yet scheduled; NEISS 2026 data expected around April 2027; NFIRS replaced by NERIS from 2026
- Geography
- United States
- Sources
- 23 (20 Tier 1)
Kitchen fires are the leading cause of US home fires: USFA estimates 167,800 residential cooking fires in 2023, 48.7% of the total, causing 125 deaths, 2,500 injuries and $572.7 million in losses. Emergency rooms treated an estimated 49,046 range and oven injuries in 2025. Thanksgiving brings 3.97 times a normal November Thursday's cooking fires.
This month in brief
- Cooking is the leading cause of US residential building fires: 167,800 of 344,600 in 2023, or 48.7% (USFA).
- Cooking fires are rarely deadly: 4.3% of 2023 residential fire deaths, 0.74 deaths per 1,000 fires against 15.64 for other causes.
- From 2014 to 2023, cooking fire deaths fell 49% and injuries 37%, while all residential fire deaths rose 5%.
- Thanksgiving is the peak: 3.97 times an ordinary November Thursday in 2025, 3.96 in 2024 and 3.9 in 2023 (NFIRS 2025 public data).
- Emergency departments treated an estimated 49,046 range and oven injuries in 2025, half of them burns and 17.7% in children 0 to 4 (CPSC NEISS 2025).
- Ranges or cooktops were involved in 64.3% of 2025 reported cooking fires that spread beyond the pan.
- Electric ranges show 3.68 times the gas rate of reported range fires per household in 2025.
- NFIRS was shut down in February 2026; December 2025 reporting fell 29.2%, so late-2025 counts need care.
Cooking fire deaths fell 49% from 2014 to 2023 while all residential fire deaths rose 5%
The number of cooking fires barely moved in ten years, but deaths and injuries from them fell sharply, in contrast with residential fires as a whole.
USFA's ten-year trend for 2014 to 2023 shows residential cooking fires down 11%, cooking fire deaths down 49%, injuries down 37% and inflation-adjusted dollar loss down 15% (USFA). Over the same years all residential building fires fell 6%, deaths rose 5%, injuries fell 8% and inflation-adjusted dollar loss rose 25% (USFA residential).
USFA national estimates
Source: USFA, Residential building cooking fires (2014-2023).
Cooking's share of residential fire injuries fell from 34.2% in 2014 to 24.0% in 2023, and its share of deaths from 9.0% to 4.3%. Cooking was still the leading cause of residential building fire injuries in 2023 (USFA injuries). The leading cause of deaths in 2023 was other unintentional or careless fires, with 625 (USFA deaths).
NFPA's fire count is lower and its death and injury counts are higher than USFA's, because NFPA uses its own fire department survey, a home rather than residential building definition, and its own allocation of unknown equipment: an average of 158,400 home cooking fires a year in 2017 to 2021, with 470 deaths, 4,150 injuries and $1.15 billion in direct damage (NFPA). NFPA's cooking safety page puts cooking equipment at 48% of home structure fires, 35% of home fire injuries and 16% of home fire deaths for 2020 to 2024 (NFPA cooking safety). The two series answer slightly different questions; this report uses USFA as the primary count and cites NFPA for detail USFA does not publish.
Thanksgiving brings nearly four times the cooking fires of an ordinary November Thursday
In the 2025 public data, fire departments reported 780 residential cooking fires on Thanksgiving, 3.97 times the average of the other Thursdays that November. The multiple was 3.96 in 2024 and 3.9 in 2023.
KBR counted residential building cooking fires by date in the NFIRS 2025 public data and the 2024 and 2023 releases. Comparing Thanksgiving with the other Thursdays of the same November holds the weekday and the season constant. The pooled 2023 to 2025 multiple is 3.94. Cooking caused 69.0% of all reported residential building fires on Thanksgiving 2025.
| Day | 2023 reported | 2023 multiple of daily mean | 2024 reported | 2024 multiple of daily mean | 2025 reported | 2025 multiple of daily mean |
|---|---|---|---|---|---|---|
| Thanksgiving | 1019 | 3.99 | 741 | 3.38 | 780 | 3.54 |
| Day before Thanksgiving | 401 | 1.57 | 310 | 1.42 | 359 | 1.63 |
| Christmas Day | 516 | 2.02 | 407 | 1.86 | 175 | 0.79 |
| Christmas Eve | 490 | 1.92 | 342 | 1.56 | 239 | 1.09 |
| Easter Sunday | 341 | 1.34 | 299 | 1.37 | 322 | 1.46 |
| New Year's Day | 360 | 1.41 | 258 | 1.18 | 284 | 1.29 |
| Independence Day | 294 | 1.15 | 235 | 1.07 | 304 | 1.38 |
Raw incidents in the NFIRS Public Data Release, not national estimates. December 2025 values are depressed because departments moved to NERIS late in 2025.
Source: [7][8][9] FEMA OpenFEMA / U.S. Fire Administration; FEMA OpenFEMA / U.S. Fire Administration; FEMA OpenFEMA / U.S. Fire Administration
Raw incidents in the NFIRS 2025 public data release
Source: USFA NFIRS Public Data Release 2025 via OpenFEMA; KBR analysis.
Christmas Day ranked second in 2023 and 2024, at 2.02 and 1.86 times the average day. In 2025 it fell to 0.79 because reporting collapsed in December: reported residential cooking fires in December 2025 were 29.2% below December 2024 as departments moved to the new NERIS system (USFA NFIRS sunset). The 2025 holiday figures after Thanksgiving should not be read as a real decline. NFPA also names Thanksgiving as the peak day, followed by Christmas Day and Christmas Eve (NFPA).
26.7% of reported cooking fires reach fire departments between 5 p.m. and 8 p.m.
The dinner hours dominate. The single busiest alarm hour in 2025 was the 18:00 hour, with 7,586 reported residential cooking fires.
Hour the fire department was alerted, local time
Source: USFA NFIRS Public Data Release 2025 via OpenFEMA; KBR analysis.
Alarms between 17:00 and 19:59 accounted for 26.7% of the 80,379 reported residential cooking fires in 2025 (NFIRS 2025 public data). The overnight trough falls at 04:00, with 672 fires. NFPA reports the same 5 p.m. to 8 p.m. peak for 2017 to 2021 and notes that late-night cooking fires carry a higher share of deaths (NFPA).
Emergency departments treated an estimated 49,046 range and oven injuries in 2025
NEISS, CPSC's hospital sample, puts 2025 emergency department visits involving ranges or ovens at 49,046 (95% CI 38,556 to 59,536). About half were burns.
KBR summed the NEISS sample weights for every 2025 case that lists product code 0278 (electric ranges or ovens), 0279 (gas ranges or ovens), 0280 (other ranges or ovens) or 0281 (ranges or ovens, not specified) in any of its three product fields (CPSC NEISS 2025; codes from the CPSC comparability table). Burns made up 50.2% of the total (24,616), and 6,899 visits (14.1%) had fire involvement coded. 14.1% of patients were admitted, transferred or held for observation.
| Group | 2025 national estimate | 2025 sample cases | 2025 CV (%) | 2025 95% CI | 2025 CPSC stability | 2024 national estimate | 2024 CPSC stability |
|---|---|---|---|---|---|---|---|
| All injuries involving ranges or ovens (codes 0278 to 0281) | 49046 | 1233 | 10.9 | 38556 to 59536 | stable | 43706 | stable |
| Burn diagnoses | 24616 | 657 | 12.4 | 18649 to 30584 | stable | 22718 | stable |
| Fire involved (NEISS fire involvement 1 to 3) | 6899 | 182 | 16.0 | 4740 to 9058 | stable | 6636 | stable |
| Admitted, transferred or held for observation | 6896 | 160 | 18.2 | 4433 to 9360 | stable | 5272 | stable |
| Age 0 to 4 | 8661 | 300 | 18.1 | 5590 to 11731 | stable | 7202 | stable |
| Age 5 to 17 | 4475 | 145 | 16.5 | 3026 to 5923 | stable | 3849 | stable |
| Age 18 to 64 | 23937 | 530 | 13.3 | 17709 to 30165 | stable | 24336 | stable |
| Age 65 and older | 11974 | 258 | 14.3 | 8617 to 15330 | stable | 8319 | stable |
| Code 0278 electric ranges or ovens | 2462 | 65 | 20.1 | 1492 to 3433 | stable | 2366 | stable |
| Code 0279 gas ranges or ovens | 5077 | 109 | 22.7 | 2823 to 7331 | stable | 4252 | stable |
| Code 0280 other ranges or ovens | 1444 | 38 | 32.1 | 534 to 2354 | stable | 1166 | unstable |
| Code 0281 ranges or ovens, not specified | 40063 | 1021 | 10.8 | 31610 to 48515 | stable | 35921 | stable |
| Microwave ovens (code 0264), all injuries | 13692 | 364 | 11.4 | 10638 to 16747 | stable | 14189 | stable |
| Microwave ovens (code 0264), burns | 7304 | 229 | 12.4 | 5525 to 9082 | stable | 8622 | stable |
KBR weighted estimates from the NEISS annual files (sum of the Weight variable). CV from a PSU-level approximation of the NEISS design. CPSC treats estimates under 1,200, from fewer than 20 cases, or with a CV over 33% as unstable.
Source: [11][12][13][14] U.S. Consumer Product Safety Commission; U.S. Consumer Product Safety Commission; U.S. Consumer Product Safety Commission; U.S. Consumer Product Safety Commission
NEISS weighted national estimates
Source: CPSC NEISS 2025 annual file; KBR weighted estimates.
Children 0 to 4 accounted for 17.7% of range and oven injuries (8,661) and adults 65 and older for 24.4% (11,974). The 2025 total was 12.2% above 2024's 43,706, but the two confidence intervals overlap, so the change is not statistically clear. Microwave ovens added 13,692 visits; ranges and ovens were involved in 3.6 times as many. Bathroom injuries are covered separately in bathroom accident statistics.
Ranges and cooktops are coded in 64.3% of cooking fires that spread past the pan
Among 2025 reported nonconfined residential cooking fires with equipment recorded, 2,855 of 4,443 involved a range or cooktop. Ovens, grills and microwaves follow far behind.
| Equipment involved in ignition (NFIRS code group) | Reported nonconfined cooking fires, 2025 | Share (%) |
|---|---|---|
| Range or cooktop | 2855 | 64.3 |
| All other equipment codes | 476 | 10.7 |
| Oven or rotisserie | 324 | 7.3 |
| Grill, hibachi or barbecue | 233 | 5.2 |
| Microwave oven | 222 | 5.0 |
| Toaster, toaster oven or countertop broiler | 105 | 2.4 |
| Grease hood or duct exhaust fan | 80 | 1.8 |
| Wok, frying pan or skillet | 76 | 1.7 |
| Deep fryer | 47 | 1.1 |
| Food warmer or hot plate | 25 | 0.6 |
Nonconfined fires only: confined cooking fires (NFIRS incident type 113) do not record equipment. Raw reported incidents.
Source: [7] FEMA OpenFEMA / U.S. Fire Administration
Share of equipment-coded nonconfined residential cooking fires
Source: USFA NFIRS Public Data Release 2025 via OpenFEMA; KBR analysis.
Equipment is recorded only for cooking fires that were not confined to the container, so these shares describe the more serious fires. NFPA's estimate across all home cooking fires in 2017 to 2021 is lower, at 53%, but ranges or cooktops were involved in 88% of cooking fire deaths and 74% of injuries (NFPA). Readers planning appliance changes can see where they fall in the kitchen remodel timeline and price them with the remodel cost calculator.
Electric ranges show about 3.7 times the reported fire rate per household of gas ranges
Electric ranges were 84.3% of fuel-coded range fires reported in 2025, while 59.1% of US households cook with electricity. Per household, that is 3.68 times the gas rate.
KBR divided reported nonconfined range or cooktop fires by fuel (NFIRS 2025 public data) by the number of households cooking with each fuel in the American Housing Survey 2023: 78.7 million electric and 54.1 million gas (piped plus LP). The electric-to-gas rate ratio was 3.5 in 2023, 3.86 in 2024 and 3.68 in 2025. NFPA's 2017 to 2021 estimate is lower, at 2.4 times, and covers all reported home cooking fires (NFPA).
| Year | Reported range fires, electric | Reported range fires, gas | Electric share of fuel-coded range fires (%) | Electric vs gas rate per household (ratio) |
|---|---|---|---|---|
| 2023 | 3448 | 677 | 83.6 | 3.5 |
| 2024 | 3142 | 560 | 84.9 | 3.86 |
| 2025 | 2334 | 436 | 84.3 | 3.68 |
Ratio = (electric range fires / 78,706,480 electric-cooking households) / (gas range fires / 54,081,826 gas-cooking households). Households from AHS 2023 for every year.
Source: [7][8][9][16] FEMA OpenFEMA / U.S. Fire Administration; FEMA OpenFEMA / U.S. Fire Administration; FEMA OpenFEMA / U.S. Fire Administration; U.S. Census Bureau and HUD
The ratio does not prove that electric ranges are intrinsically more dangerous. NFPA notes it is less obvious when an electric burner is on or still hot, and that electric elements take time to cool (NFPA). Since June 2018, per NFPA, UL 858 has required new electric coil ranges to pass a test that keeps cooking oil from igniting, with a dry-pan alternative of an average pan temperature no higher than 385 degrees Celsius for 30 minutes (NIST TN 1986; UL Standards and Engagement). CPSC staff supported the proposal in 2015 (CPSC staff letter). Gas-stove regulation is covered in our gas stove ban tracker.
Nine range and cooktop recalls since 2016 cited fire or burn hazards, covering 1,872,570 units
Two recalls for front-mounted knobs that can be switched on by accidental contact account for 1,620,905 of those units, 86.6%.
KBR searched every recall in the CPSC Recall API dated 2016 to 2025 for household ranges, ovens, cooktops and stoves, removing portable, countertop, camping and heating appliances. That left 17 recall notices, of which 9 cite a fire, burn or gas-ignition hazard. Others cite tip-over, carbon monoxide, electric shock or impact hazards. The list is a factual record of CPSC notices, not a rating of any brand.
| Recall date | Recall number | Recall title | Hazard class (KBR reading of CPSC hazard text) | US units | CPSC URL |
|---|---|---|---|---|---|
| 2016-07-26 | 16759 | Frigidaire and Kenmore Wall Ovens Recalled by Electrolux Due to Fire Hazard (Recall Alert) | fire | 1000 | https://www.cpsc.gov/Recalls/2016/Frigidaire-and-Kenmore-Wall-Ovens-Recalled-by-Electrolux |
| 2017-05-19 | 17159 | Following Plumber's Death, Electric Ranges Recalled by Arçelik A.S. Due to Shock and Electrocution Hazards | electric shock | 6300 | https://www.cpsc.gov/Recalls/2017/Following-Plumbers-Death-Electric-Ranges-Recalled-by-Arcelik-AS |
| 2018-09-11 | 18218 | Gas Ranges and Wall Ovens Recalled by Prizer-Painter Stove Works Due to Burn Hazard | burn (gas ignition) | 7100 | https://www.cpsc.gov/Recalls/2018/Gas-Ranges-and-Wall-Ovens-Recalled-by-PrizerPainter-Stove-Works-Due-to-Burn-Hazard |
| 2019-08-28 | 19189 | Whirlpool Recalls Glass Cooktops with Touch Controls Due to Burn and Fire Hazards | burn and fire | 26300 | https://www.cpsc.gov/Recalls/2019/Whirlpool-Recalls-Glass-Cooktops-with-Touch-Controls-Due-to-Burn-and-Fire-Hazards |
| 2021-12-08 | 22028 | GE Appliances, a Haier Company, Recalls to Repair Free-Standing and Slide-In Ranges Due to Tip-Over Hazard | tip-over | 132000 | https://www.cpsc.gov/Recalls/2022/GE-Appliances-a-Haier-Company-Recalls-to-Repair-Free-Standing-and-Slide-In-Ranges-Due-to-Tip-Over-Hazard |
| 2022-02-16 | 22082 | Viking Range Recalls Freestanding Gas Ranges Due to Risk of Gas Leak and Fire Hazard | gas leak and fire | 3050 | https://www.cpsc.gov/Recalls/2022/Viking-Range-Recalls-Freestanding-Gas-Ranges-Due-to-Risk-of-Gas-Leak-and-Fire-Hazard |
| 2022-03-09 | 22093 | Danby Products Recalls Free-Standing and Slide-in Electric and Gas Ranges Due to Tip-Over Hazard and Risk of Burn Injuries | tip-over | 1700 | https://www.cpsc.gov/Recalls/2022/Danby-Products-Recalls-Free-Standing-and-Slide-in-Electric-and-Gas-Ranges-Due-to-Tip-Over-Hazard-and-Risk-of-Burn-Injuries |
| 2022-12-29 | 23083 | ZLINE Recalls Gas Ranges Due to Serious Risk of Injury or Death from Carbon Monoxide Poisoning | carbon monoxide | 28000 | https://www.cpsc.gov/Recalls/2023/ZLINE-Recalls-Gas-Ranges-Due-to-Serious-Risk-of-Injury-or-Death-from-Carbon-Monoxide-Poisoning |
| 2023-01-26 | 23107 | ZLINE Expands Recall of Gas Ranges to Include 48-inch Gas Ranges Due to Serious Risk of Injury or Death from Carbon Monoxide Poisoning | carbon monoxide (expansion) | 30000 | https://www.cpsc.gov/Recalls/2023/ZLINE-Expands-Recall-of-Gas-Ranges-to-Include-48-inch-Gas-Ranges-Due-to-Serious-Risk-of-Injury-or-Death-from-Carbon-Monoxide-Poisoning |
| 2023-08-31 | 23269 | Electrolux Group Recalls Frigidaire Gas Cooktops Due to Risk of Gas Leak, Fire Hazard | gas leak and fire | 215 | https://www.cpsc.gov/Recalls/2023/Electrolux-Group-Recalls-Frigidaire-Gas-Cooktops-Due-to-Risk-of-Gas-Leak-Fire-Hazard |
| 2023-11-21 | 24028 | ZLINE Expands Consumer Options in Recall of Gas Ranges; Serious Risk of Injury or Death from Carbon Monoxide Poisoning | carbon monoxide (expanded remedy) | 30000 | https://www.cpsc.gov/Recalls/2024/ZLINE-Expands-Consumer-Options-in-Recall-of-Gas-Ranges-Serious-Risk-of-Injury-or-Death-from-Carbon-Monoxide-Poisoning |
| 2023-11-30 | 24033 | GE Appliances, a Haier Company, Recalls Electric Cooktops Due to Burn Hazard | burn | 11000 | https://www.cpsc.gov/Recalls/2024/GE-Appliances-a-Haier-Company-Recalls-Electric-Cooktops-Due-to-Burn-Hazard |
| 2024-02-15 | 24117 | Electrolux Group Recalls Frigidaire Rear-Controlled Ranges Due to Electric Shock and Electrocution Hazards | electric shock | 1800 | https://www.cpsc.gov/Recalls/2024/Electrolux-Group-Recalls-Frigidaire Rear-Controlled-Ranges-Due-to-Electrical-Shock-and-Electrocution-Hazards |
| 2024-05-09 | 24226 | ZLINE Recalls Built-In Electric Wall Ovens Due to Impact Injury Hazard | impact | 5000 | https://www.cpsc.gov/Recalls/2024/ZLINE-Recalls-Built-In-Electric-Wall-Ovens-Due-to-Impact-Injury-Hazard |
| 2024-05-16 | 24235 | Electrolux Group Reannounces Recall of Frigidaire and Kenmore Electric Ranges Due to Fire and Burn Hazards; Multiple Fires and Injuries Reported | fire and burn | 203000 | https://www.cpsc.gov/Recalls/2024/Electrolux-Group-Reannounces-Recall-of-Frigidaire-and-Kenmore-Electric-Ranges-Due-to-Fire-and-Burn-Hazards-Multiple-Fires-and-Injuries-Reported |
| 2024-08-08 | 24335 | Samsung Recalls Slide-In Electric Ranges Due to Fire Hazard | fire (front knobs) | 1120905 | https://www.cpsc.gov/Recalls/2024/Samsung-Recalls-Slide-In-Electric-Ranges-Due-to-Fire-Hazard |
| 2025-02-06 | 25126 | LG Recalls Electric Ranges Due to Fire Hazard | fire (front knobs) | 500000 | https://www.cpsc.gov/Recalls/2025/LG-Recalls-Electric-Ranges-Due-to-Fire-Hazard |
Matched by keyword in the CPSC Recall API, then hazard class assigned by KBR from each notice's hazard text. Units are the US figure in the notice. Recall titles reproduced as published by CPSC.
Source: [17] U.S. Consumer Product Safety Commission
What USFA and NFPA publish about putting out a grease fire
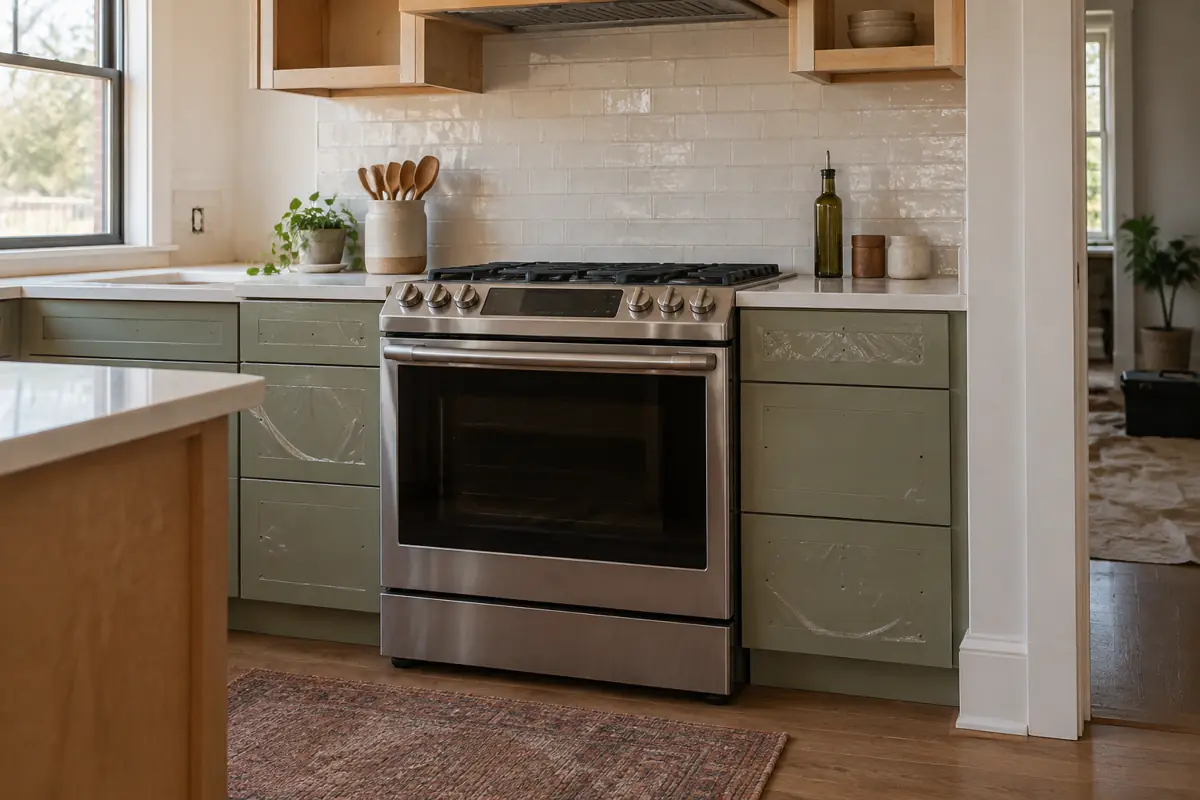
Both agencies tell households to smother a small pan fire with a lid and turn off the heat. This report repeats their published wording and adds nothing of its own.
- USFA: keep a pan lid or baking sheet nearby and use it to cover the pan if it catches fire; stand by your pan and turn the burner off if you leave the kitchen (USFA cooking safety).
- NFPA: smother a small grease fire by sliding the lid over the pan and turning off the stovetop, and leave the pan covered until it is completely cool; for an oven fire, turn off the heat and keep the door closed (NFPA cooking safety).
- NFPA: for any cooking fire, just get out, close the door behind you and call 9-1-1 (NFPA cooking safety).
- USFA: unattended equipment was the leading factor contributing to ignition in 37% of nonconfined home cooking fires (USFA cooking safety).
Momentum and share analysis
Cooking share of residential building fires, deaths, injuries and loss
Formulacooking value / all residential building value x 100, same year
Inputs: rows 74, 73, 76, 75, 78, 77 (fact sheet rows)
Result: fires 48.7; deaths 4.3; injuries 24.0; dollar loss 5.1
Cooking fires are numerous but mostly small; their share of deaths is roughly a tenth of their share of fires.
Limitations: Both inputs are rounded USFA estimates; full 2014 to 2023 series in tables/t1.csv.
Deaths per 1,000 fires, cooking vs all other causes (2023)
Formulacooking deaths / cooking fires x 1,000; (all deaths - cooking deaths) / (all fires - cooking fires) x 1,000
Inputs: rows 74, 76, 78, 80, 73, 75, 77, 79 (fact sheet rows)
Result: cooking 0.74; all other causes 15.64; ratio 21.1
A residential fire from another cause was about 21 times as likely to kill someone as a cooking fire in 2023.
Limitations: Most cooking fires are confined to the pan or oven and minor; other causes include fires still under investigation.
Thanksgiving multiple vs other November Thursdays (signature finding)
FormulaThanksgiving count / mean count on the other Thursdays of November, same year; pooled = sum of Thanksgiving counts / sum of Thursday means
Inputs: rows 101, 102, 114, 115, 127, 128 (fact sheet rows)
Result: 2025 3.97; 2024 3.96; 2023 3.9; pooled 2023 to 2025 3.94
The holiday spike is stable across three releases at close to four times an ordinary Thursday, unaffected by the late-2025 reporting drop.
Limitations: Raw NFIRS PDR counts; ratio assumes reporting coverage is the same on Thanksgiving as on other November Thursdays.
Thanksgiving multiple vs annual daily mean
FormulaThanksgiving count / (annual reported cooking fires / days in year)
Inputs: rows 101, 98, 114, 111, 127, 124 (fact sheet rows)
Result: 2025 3.54; 2024 3.38; 2023 3.99
A conventional comparison; it moves more because the annual mean includes slow summer weeks and the December 2025 reporting gap.
Limitations: 2025 is depressed by the drop in December 2025 reporting as departments moved to NERIS.
Burn share of range and oven ED injuries (2025)
Formulaburn estimate / all range or oven estimate x 100
Inputs: rows 220, 218 (fact sheet rows)
Result: 50.2
About half of ED visits tied to ranges and ovens are burns; the rest include cuts, strains and tip-over injuries.
Limitations: Ratio of two estimates from the same sample; burns = diagnosis codes 46, 47, 48, 49, 51, 73 in either diagnosis field.
Range or cooktop share of nonconfined cooking fires (2025)
Formularange or cooktop count / all equipment-coded nonconfined cooking fires x 100
Inputs: rows 179, 180, 181, 182, 183, 184, 185, 186, 187, 188 (fact sheet rows)
Result: 64.3 (2855 of 4443 equipment-coded fires)
Ranges and cooktops dominate the fires that escape the pan.
Limitations: Excludes the confined (type 113) majority of cooking fires, which do not record equipment.
Electric vs gas reported range fire rate per household
Formula(electric range fires / electric-cooking households) / (gas range fires / gas-cooking households)
Inputs: rows 194, 195, 196, 197, 198, 199, 189, 190, 191 (fact sheet rows)
Result: 2025 3.68; 2024 3.86; 2023 3.5
Electric ranges appear in reported range fires at several times the gas rate per household in every year checked.
Limitations: Household denominators are AHS 2023 for all years; nonconfined fires only; fuel uncoded fires excluded; reporting may differ by fuel.
Early read: cooking share of known-cause residential fires, 2024 and 2025
Formulareported cooking fires / (reported residential building fires - unknown cause) x 100
Inputs: rows 98, 97, 100, 111, 110, 113, 124, 123, 126 (fact sheet rows)
Result: 2023 48.6; 2024 46.6; 2025 50.6
Raw data show no sign that cooking's share is shrinking; USFA has not yet published estimates for these years.
Limitations: Replicates the share step of USFA's estimate method (2023 check: USFA published share 48.7). Not a USFA estimate for 2024 or 2025.
Evening share of cooking fire alarms (2025)
Formula(alarms in hours 17, 18, 19) / all cooking fires with an alarm time x 100
Inputs: rows 172, 173, 174 (fact sheet rows)
Result: 26.7
More than a quarter of reported cooking fires reach fire departments in the three dinner hours.
Limitations: Alarm time is when the fire department was notified, not ignition time.
Range recall units with fire or burn hazards, 2016 to 2025
Formulasum of US units across recalls 16759, 18218, 19189, 22082, 23269, 24033, 24235, 24335, 25126
Inputs: rows 255, 256, 257, 258, 259, 260, 261, 262, 263, 264, 265, 266, 267, 268, 269, 270, 271 (fact sheet rows)
Result: 1872570 units in 9 recalls
Recall volume is driven by two front-knob recalls, not by many small ones.
Limitations: Keyword-matched from the CPSC Recall API, then classified by hand; a recall missing the words range, cooktop, stove or oven in its title or product name would be missed.
Findings to track
- USFA estimates 167,800 US residential building cooking fires in 2023, 48.7% of all 344,600 residential building fires.[1][2]
- Cooking fires caused 125 of 2,890 US residential building fire deaths in 2023 (4.3%) and 2,500 of 10,400 injuries (24.0%).[1][2]
- US residential cooking fire deaths fell 49% from 2014 to 2023, while deaths from all residential building fires rose 5%.[1][2]
- In 2023 US cooking fires caused 0.74 deaths per 1,000 fires, against 15.64 for all other residential building fires.[1][2]
- Thanksgiving 2025 had 780 reported residential cooking fires in NFIRS, 3.97 times the average of the other November 2025 Thursdays; the multiple was 3.96 in 2024 and 3.9 in 2023.[7][8][9]
- 26.7% of 2025 reported US residential cooking fires had an alarm between 5 p.m. and 8 p.m.[7]
- US emergency departments treated an estimated 49,046 injuries involving ranges or ovens in 2025 (95% CI 38,556 to 59,536), 50.2% of them burns.[11]
- Children 0 to 4 accounted for an estimated 8,661 US range and oven ED injuries in 2025, 17.7% of the total.[11]
- Ranges or cooktops were coded in 64.3% of 2025 US reported residential cooking fires that spread beyond the container.[7]
- Per household, electric ranges appeared in reported US range fires at 3.68 times the gas rate in 2025, using AHS 2023 household counts.[7][16]
- From 2016 to 2025, 9 CPSC recalls of household ranges, ovens or cooktops cited fire or burn hazards, covering 1,872,570 US units.[17]
- Reported cooking fires were 50.6% of 2025 US residential building fires with a known cause in the NFIRS public data, up from 46.6% in 2024.[7][8]
- NFPA estimates ranges or cooktops were involved in 53% of US home cooking fires and 88% of cooking fire deaths in 2017 to 2021.[21]
Questions people ask
What causes most kitchen fires?
Cooking itself, usually left unattended. USFA says unattended equipment was the leading factor in 37% of nonconfined home cooking fires, and NFPA found cooking materials such as food, fat and grease were first ignited in 66% of home cooking fires in 2017 to 2021 (USFA; NFPA).
How do you put out a grease fire?
USFA and NFPA both say to cover the pan with a lid or baking sheet and turn off the burner, then leave it covered until cool; NFPA adds that for an oven fire you turn off the heat and keep the door closed, and that if in doubt you get out and call 9-1-1 (USFA; NFPA). This is quoted agency guidance, not advice.
Are gas or electric stoves more likely to cause fires?
Electric. In 2025 NFIRS data, electric ranges appeared in reported range fires at 3.68 times the gas rate per household, and NFPA's 2017 to 2021 estimate is 2.4 times. Injury data cannot settle it: 81.7% of 2025 NEISS range and oven injuries do not record the fuel.
What day has the most cooking fires?
Thanksgiving. In 2025 fire departments reported 780 residential cooking fires that day, 3.97 times an ordinary November Thursday; the day before Thanksgiving was second with 359 (NFIRS 2025 public data).
How many house fires start in the kitchen?
USFA counts cooking fires rather than room of origin: 167,800 in 2023, 48.7% of residential building fires. NFPA puts cooking equipment at 48% of home structure fires in 2020 to 2024 (NFPA).
Download the data
Every table in this report is available as a CSV under CC BY 4.0. The fact sheet lists each value with its source URL and access date.
- derived_metrics.csv (CSV)
- fact_sheet.csv (CSV)
- US residential building cooking fires and their share of all residential building fires, 2014 to 2023 (CSV)
- Cooking fires vs all other residential building fires, US, 2023 (CSV)
- Reported residential cooking fires on holidays and their multiple of the year's average day, 2023 to 2025 (CSV)
- Emergency department injuries involving ranges, ovens and microwaves, NEISS national estimates, 2025 and 2024 (CSV)
- Equipment involved in 2025 reported residential cooking fires that spread beyond the container (CSV)
- Electric vs gas range or cooktop fires per household, reported nonconfined residential cooking fires, 2023 to 2025 (CSV)
- CPSC recalls of household ranges, ovens and cooktops, 2016 to 2025 (CSV)
For journalists and researchers
If you cite only a few, cite these
- 167,800 US residential building cooking fires in 2023, 48.7% of the total (USFA).[2][1]
- Thanksgiving: 3.97 times the cooking fires of an ordinary November Thursday, 2025 (KBR analysis of NFIRS).[7]
- 49,046 ED visits involving ranges or ovens in 2025 (KBR estimate from CPSC NEISS).[11]
Most quotable statistics
- Cooking caused 48.7% of US residential building fires in 2023 but 4.3% of the deaths (USFA).[1][2]
- Thanksgiving 2025 brought 3.97 times the reported cooking fires of an average November Thursday (KBR analysis of NFIRS).[7]
- US emergency departments treated an estimated 49,046 injuries involving ranges or ovens in 2025 (KBR estimate from CPSC NEISS).[11]
- US residential cooking fire deaths fell 49% from 2014 to 2023 (USFA).[2]
- Ranges or cooktops were involved in 64.3% of 2025 reported cooking fires that spread beyond the pan (NFIRS).[7]
- Electric ranges showed 3.68 times the gas rate of reported range fires per household in 2025 (KBR analysis of NFIRS and AHS).[7][16]
Press summary
Kitchen fires remain the leading cause of US home fires, but they are becoming less deadly. U.S. Fire Administration estimates show 167,800 residential building cooking fires in 2023, 48.7% of all residential building fires, with 125 deaths, 2,500 injuries and $572.7 million in losses. Cooking fire deaths fell 49% from 2014 to 2023 while deaths from all residential fires rose 5%. A Kitchen and Bath Renovators analysis of the newest NFIRS incident files finds Thanksgiving 2025 brought 3.97 times the cooking fires of an ordinary November Thursday, a multiple that held near four in 2023 and 2024. CPSC hospital data put 2025 emergency department visits involving ranges or ovens at an estimated 49,046, half of them burns. Ranges or cooktops were involved in 64.3% of reported cooking fires that spread beyond the pan, and electric ranges showed 3.68 times the gas rate per household. The national NFIRS system closed in February 2026, so future counts will come from NERIS.
Suggested headlines
- Thanksgiving brings 3.97 times the kitchen fires of an ordinary Thursday
- Kitchen fires: 48.7% of home fires, 4.3% of fire deaths
- Cooking fire deaths fell 49% in a decade as other home fire deaths rose
- ERs treated 49,046 range and oven injuries in 2025
- Electric ranges show 3.68 times the fire rate of gas per household
How to cite this report
Kitchen and Bath Renovators. (2026). Kitchen Fires: US Home Cooking Fire Statistics and Trends (2026 Tracker). Retrieved from https://kitchenandbathrenovators.com/research/kitchen-fire-statistics/
Reuse license
Data and tables are licensed CC BY 4.0. Attribution: “Source: Kitchen and Bath Renovators, Kitchen Fires: US Home Cooking Fire Statistics and Trends (2026 Tracker)” with a link to this page.
Frequently asked questions
How many kitchen fires happen in the US each year?
USFA estimates 167,800 residential building cooking fires in 2023, down from 189,800 in 2014. NFPA's 2017 to 2021 average is 158,400 home cooking fires a year.
How many people die in kitchen fires each year?
USFA estimates 125 residential building cooking fire deaths in 2023, down from 250 in 2014. NFPA's broader home estimate averages 470 a year for 2017 to 2021.
How many people are injured in cooking fires?
USFA estimates 2,500 residential cooking fire injuries in 2023, still the leading cause of residential fire injuries. Separately, NEISS estimates 49,046 2025 emergency department visits involving ranges or ovens.
How much damage do cooking fires cause?
USFA estimates $572.7 million in 2023 residential cooking fire losses, an average of $3,413 per fire. Other residential fires averaged $60,484.
Why are cooking fires so common but rarely fatal?
Most stay in the pan or oven. In 2025, 75,936 of 80,379 reported residential cooking fires were coded as confined to the container, and NFPA puts the confined share at 80%.
How much more likely is a cooking fire on Thanksgiving?
In NFIRS data, Thanksgiving had 3.97 times the cooking fires of an average November Thursday in 2025, 3.96 in 2024 and 3.9 in 2023.
What time of day do most kitchen fires start?
In 2025, 26.7% of reported residential cooking fires had an alarm between 5 p.m. and 8 p.m., and the 18:00 hour was the busiest, with 7,586.
Which cooking appliance causes the most fires?
Ranges and cooktops: 64.3% of 2025 reported cooking fires that spread past the pan, and 88% of cooking fire deaths in NFPA's 2017 to 2021 estimate.
Who is most at risk of a cooking injury?
By volume, adults 18 to 64 (23,937 range and oven ED visits in 2025). Children 0 to 4 had 8,661, and NFPA reports people 85 and older face 5.5 times the population's cooking fire death risk.
Are range recalls a big source of kitchen fires?
Recalls are a small, separate signal. From 2016 to 2025, 9 CPSC range, oven or cooktop recalls cited fire or burn hazards, covering 1,872,570 units; most fires in NFIRS involve normal use, not recalled products.
Reproduce this analysis
Every figure comes from the files below. The scripts that pulled and computed them are kept with the report and can be re-run.
| Dataset | Publisher | Source | Query or filter | Rows used | Retrieved |
|---|---|---|---|---|---|
| Residential Fire Estimate Summaries and cooking, causes, deaths and injuries pages | U.S. Fire Administration | File or endpoint | Published 2014 to 2023 series for all residential building fires and for cooking (typed from the page tables, saved in raw/) | 10 years x 4 measures x 2 groups | 2026-10-27 |
| NFIRS Public Data Release 2025, fire and hazmat | FEMA OpenFEMA / USFA | File or endpoint | basicincident.txt INC_TYPE in 111, 113-118, 120-123; PROP_USE 4xx; AID not 3 or 4; joined to causes.txt CAUSE_CODE 05; fireincident.txt EQUIP_INV and EQ_POWER for nonconfined fires | 203,144 residential building fires, 80,379 cooking | 2026-10-27 |
| NFIRS Public Data Release 2024, fire and hazmat | FEMA OpenFEMA / USFA | File or endpoint | Same filters as 2025 | 221,308 residential building fires, 80,130 cooking | 2026-10-27 |
| NFIRS Public Data Release 2023, fire and hazmat | FEMA OpenFEMA / USFA | File or endpoint | Same filters as 2025 | 242,595 residential building fires, 93,111 cooking | 2026-10-27 |
| NEISS annual data 2025 and 2024 | U.S. Consumer Product Safety Commission | File or endpoint | Product_1, Product_2 or Product_3 in 0278, 0279, 0280, 0281 (and 0264 separately); weighted by Weight; Stratum and PSU for variance | 1233 cases in 2025 and 1067 in 2024 for ranges or ovens | 2026-10-27 |
| American Housing Survey 2023 national PUF | U.S. Census Bureau and HUD | File or endpoint | household.csv, INTSTATUS = 1, COOKFUEL weighted by WEIGHT; standard errors from 160 replicate weights | 132,788,306 weighted gas or electric cooking households | 2026-10-27 |
| CPSC Recall API | U.S. Consumer Product Safety Commission | File or endpoint | All recalls dated 2016-01-01 to 2025-12-31, pulled by year or smaller windows; keyword match on title and product name, then manual hazard classification | 17 matched recall notices | 2026-10-27 |
Data quality and exclusions
- NFIRS 2025: excluded 52,514 residential building fire records coded as aid given (codes 3 or 4) to avoid double counting; 2024 excluded 63,471 and 2023 excluded 68,035.
- NFIRS: 44,235 of 203,144 reported 2025 residential building fires had an unknown cause; they are left out of the known-cause share, as in USFA's method.
- NFIRS 2025: reported December cooking fires were 29.2% below December 2024 because of the NERIS transition; the Thanksgiving signature uses November Thursdays only so the drop does not affect it.
- NEISS: age code 0 (unknown) is excluded from age groups; ages over 200 are converted from months. The 2025 file has 410,201 records.
- NEISS: the 2024 estimate for code 0280 (other ranges or ovens) is flagged unstable under the CPSC rule; no other reported group is unstable.
- CPSC recalls: some API date windows returned errors and were re-pulled in shorter windows until every window from 2016 to 2025 returned data; 17 notices remained after removing portable, countertop, camping and heating products.
- AHS: households with no cooking fuel or other fuels are excluded from the per-household rate.
Methodology
Source selection: USFA residential building fire estimates are the primary national count because they are official, annual and published by cause. The NFIRS Public Data Release (2023, 2024 and 2025 fire and hazmat files on OpenFEMA) supplies incident-level detail for dates, hours, equipment and fuel. CPSC NEISS supplies emergency department injuries. NFPA is cited for headline figures only, with its data years, and its tables are not reproduced. AHS 2023 supplies households by cooking fuel.
Inclusion rules for NFIRS: residential building fires are incident types 111, 113 to 118 and 120 to 123 in the 400-series property uses, excluding aid given (codes 3 and 4) to avoid double counting, following USFA definitions. Cooking fires are those USFA's structure fire cause file assigns to the Cooking main cause. Raw counts are used only inside ratios (Thanksgiving vs other Thursdays, shares, rates per household), never as national totals, as USFA instructs.
NEISS: KBR summed the Weight variable for cases with product code 0278, 0279, 0280 or 0281 (ranges or ovens) or 0264 (microwave ovens) in any product field. Burns are diagnosis codes 46, 47, 48, 49, 51 or 73 in either diagnosis field. Variance uses a with-replacement approximation over primary sampling units within the five NEISS strata. Estimates under 1,200, from fewer than 20 cases, or with a CV over 33% are flagged unstable, per CPSC.
Conflicting numbers: USFA and NFPA disagree because NFPA uses its own fire experience survey, a broader home definition and allocation of unknown equipment; this report presents USFA as the count and labels every NFPA figure. KBR checked its NFIRS filter by reproducing USFA's 2023 cooking share (48.6% vs 48.7% published).
Derived metrics: every formula, input row and result is in derived_metrics.csv and is reproducible with the scripts in the scripts folder.
Limitations: NFIRS is voluntary and not a census; 2025 reporting fell late in the year as departments moved to NERIS. NEISS counts ED visits, not all injuries. Equipment and fuel are recorded only for fires that spread beyond the container. Last updated 2026-10-27.
This report presents published data with its limitations. It is not legal, financial or investment advice.
Sources, ranked by quality
Tier 1: primary and official sources (20)
- [1] U.S. Fire Administration (FEMA). Residential Fire Estimate Summaries (2014-2023). 2014 to 2023. Accessed 2026-10-27.
- [2] U.S. Fire Administration (FEMA). Residential building cooking fires (2014-2023). 2014 to 2023. Accessed 2026-10-27.
- [3] U.S. Fire Administration (FEMA). Leading causes of residential building fires (2014-2023). 2014 to 2023. Accessed 2026-10-27.
- [4] U.S. Fire Administration (FEMA). Leading causes of residential building fire injuries (2014-2023). 2014 to 2023. Accessed 2026-10-27.
- [5] U.S. Fire Administration (FEMA). Leading causes of residential building fire deaths (2014-2023). 2014 to 2023. Accessed 2026-10-27.
- [6] U.S. Fire Administration (FEMA). National Estimates Methodology for Building Fires and Losses. methodology. Accessed 2026-10-27.
- [7] FEMA OpenFEMA / U.S. Fire Administration. NFIRS Public Data Release 2025, Fire and Hazmat incidents (initial release, with release notes and causes.txt). 2025. Accessed 2026-10-27.
- [8] FEMA OpenFEMA / U.S. Fire Administration. NFIRS Public Data Release 2024, Fire and Hazmat incidents. 2024. Accessed 2026-10-27.
- [9] FEMA OpenFEMA / U.S. Fire Administration. NFIRS Public Data Release 2023, Fire and Hazmat incidents. 2023. Accessed 2026-10-27.
- [10] U.S. Fire Administration (FEMA). NFIRS Sunset. 2025 to 2026. Accessed 2026-10-27.
- [11] U.S. Consumer Product Safety Commission. NEISS annual data file 2025 (neiss2025.tsv). 2025. Accessed 2026-10-27.
- [12] U.S. Consumer Product Safety Commission. NEISS annual data file 2024 (neiss2024.tsv). 2024. Accessed 2026-10-27.
- [13] U.S. Consumer Product Safety Commission. NEISS 2025 Product Code Comparability Table. codes in use through 2025. Accessed 2026-10-27.
- [14] U.S. Consumer Product Safety Commission. Explanation of NEISS Estimates Obtained Through the CPSC Website. current guidance. Accessed 2026-10-27.
- [15] U.S. Consumer Product Safety Commission. National Electronic Injury Surveillance System (NEISS). release schedule. Accessed 2026-10-27.
- [16] U.S. Census Bureau and HUD. American Housing Survey 2023 National Public Use File v1.1 (CSV). 2023. Accessed 2026-10-27.
- [17] U.S. Consumer Product Safety Commission. SaferProducts.gov Recall API (recalls dated 2016-01-01 to 2025-12-31). 2016 to 2025. Accessed 2026-10-27.
- [18] U.S. Fire Administration (FEMA). Cooking fire safety outreach materials. page reviewed 2026-09-28. Accessed 2026-10-27.
- [19] National Institute of Standards and Technology. NIST Technical Note 1986: Investigation of Residential Cooktop Ignition Prevention Technologies. May 2018. Accessed 2026-10-27.
- [20] U.S. Consumer Product Safety Commission. CPSC staff comments on proposed UL 858 coil surface unit cooking oil ignition test. 2015-01-02. Accessed 2026-10-27.
Tier 2: trade bodies, market research, company data (3)
- [21] National Fire Protection Association. Home Cooking Fires (NFPA research report, 2017 to 2021 data). 2017 to 2021. Accessed 2026-10-27.
- [22] National Fire Protection Association. Cooking safety. 2020 to 2024. Accessed 2026-10-27.
- [23] UL Standards & Engagement. Household Oven and Range Standards: Helping to Mitigate the Risk of Burns. standard summary. Accessed 2026-10-27.