How Long Do Toilets Last? Flush Rules, Breakdowns and Parts
- Primary data
- American Housing Survey 2023 National PUF v1.1 (Census Bureau and HUD)
- Data period
- 2023 (3 months before interview); rules 1992 to 2026
- Latest release used
- 2025-01-22
- Next release
- AHS 2025 PUF (not posted as of 2026-11-01)
- Geography
- United States
- Sources
- 31 (22 Tier 1)
Forty years for the china bowl but 10 for the flush valve: that is HUD's planning answer to how long do toilets last, and EPA says flappers need replacing at least every five years. In AHS 2023, 1.72% of US households lost every working toilet within three months; one-bath homes hit 3.31%, 3.2 times the 1.03% elsewhere.
Registry of US toilet flush-volume rules, 1994 to 2026
Checked Quarterly, and whenever ASAP, a state legislature or the CEC posts a toilet action. Last checked 2026-11-01. Entries are neutral records of public data; each links to its source record.
| Jurisdiction or program | Rule or action | Date | Evidence | Source |
|---|---|---|---|---|
| United States (Congress) | Energy Policy Act of 1992 adds 42 U.S.C. 6295(k): 1.6 gpf cap on gravity tank, flushometer tank and electromechanical toilets made after January 1, 1994; 3.5 gpf for blowout toilets | 1994-01-01 | agency record | Record |
| United States (DOE rule) | 10 CFR 430.32(q): 1.6 gpf cap extended to flushometer valve toilets (other than blowout) made after January 1, 1997 | 1997-01-01 | agency record | Record |
| U.S. EPA WaterSense | Initial Tank-Type High-Efficiency Toilet Specification released (1.28 gpf level) | 2007-01 | agency record | Record |
| California | Standard adopted (ASAP timeline); earliest state entry in that timeline | 2007 | secondary compilation (ASAP) | Record |
| Texas | H.B. 2667 adopted: toilets sold or distributed on or after January 1, 2014 may not exceed 1.28 gpf | 2009 | agency record | Record |
| Georgia | Standard adopted (ASAP timeline) | 2010 | secondary compilation (ASAP) | Record |
| U.S. Department of Energy | Waiver of federal preemption for toilet standards, letting states set stricter limits (as reported by ASAP) | 2010 | secondary compilation (ASAP) | Record |
| Georgia | Standard effective (ASAP timeline) | 2012 | secondary compilation (ASAP) | Record |
| Texas | 1.28 gpf limit takes effect for toilets sold in the state | 2014-01-01 | agency record | Record |
| California | Standard effective (ASAP timeline lists 2014 and a second CA effective date in 2016) | 2014 | secondary compilation (ASAP) | Record |
| Colorado | Standard adopted: water closets sold must be WaterSense-listed (C.R.S. 6-7.5-105(1)(e)) | 2014 | corroborated | Record |
| U.S. EPA WaterSense | Tank-type toilet specification Version 1.2 takes effect (1.28 gpf effective flush volume) | 2014-06-02 | agency record | Record |
| Colorado | WaterSense-only sales requirement effective (ASAP timeline) | 2016 | secondary compilation (ASAP) | Record |
| California | Second standard effective date (ASAP timeline) | 2016 | secondary compilation (ASAP) | Record |
| Nevada | Standard adopted (ASAP timeline) | 2019 | secondary compilation (ASAP) | Record |
| Washington | 2019 c 286: water closets must meet California Title 20 section 1605.3 as in effect January 1, 2018 (RCW 19.260.040(15)(h)) | 2019 | agency record | Record |
| New York | Standard adopted; ECL 15-0314(2)(e) caps water closets at 1.28 gpf | 2019 | corroborated | Record |
| Nevada | Standard effective (ASAP timeline) | 2020 | secondary compilation (ASAP) | Record |
| District of Columbia | Standard adopted (ASAP timeline) | 2020 | secondary compilation (ASAP) | Record |
| Washington | Standard effective (ASAP timeline) | 2021 | secondary compilation (ASAP) | Record |
| New Jersey, Massachusetts, Rhode Island, Maine | Standards adopted (ASAP timeline) | 2021 | secondary compilation (ASAP) | Record |
| New York, New Jersey, Massachusetts, District of Columbia | Standards effective (ASAP timeline) | 2022 | secondary compilation (ASAP) | Record |
| Maryland | Standard adopted (ASAP timeline) | 2022 | secondary compilation (ASAP) | Record |
| Rhode Island, Maine | Standards effective (ASAP timeline) | 2023 | secondary compilation (ASAP) | Record |
| Maryland | Standard effective; latest state toilet standard in ASAP's timeline | 2024 | secondary compilation (ASAP) | Record |
| U.S. EPA WaterSense | Version 2.0 released: one 1.28 gpf maximum for single flush and the full flush of dual-flush toilets; stated effective date July 1, 2025, later paused by EPA, Version 1.2 stays in effect | 2024-05 | agency record | Record |
| California Energy Commission | Request for information on water closets: near-term dual-flush limits of 1.28 gpf full and 0.9 gpf reduced; long-term options include a 1.1 gpf single-flush cap | 2026-03-20 | agency record | Record |
Part by part, how long do toilets last: 40 years for the china, 5 for a flapper
A toilet is a long-lived china fixture wrapped around short-lived rubber and plastic parts, so any single lifespan figure hides the part that actually fails first.
HUD's capital needs assessment table assigns toilets, bidets and urinals an estimated useful life of 40 years in both family and elderly properties, but flush valves only 10 years in family properties and 15 years in elderly properties (HUD CNA e-Tool EUL table, dated 2017).
Dividing the two HUD figures gives 4.0 flush valve replacements over one toilet life in family housing and 2.67 in elderly housing, where fixtures see lighter use (KBR calculation d8).
The U.S. Environmental Protection Agency tells households to check the flapper periodically and replace it at least every five years, because the rubber seal wears out and a worn flapper is the usual cause of toilet leaks (EPA WaterSense, Fix a Leak Week, accessed 2026-11-01).
| Component | Planning life or replacement guidance | Warranty terms found (2025 to 2026) |
|---|---|---|
| Toilet, bidet or urinal (china fixture) | 40 years (HUD EUL, family and elderly) | Lifetime on chinaware (American Standard residential); 1 year on select vitreous china (TOTO) |
| Flush valve | 10 years family, 15 years elderly (HUD EUL) | 2, 5 or 10 years on mechanical parts by line (American Standard residential) |
| Flapper | Replace at least every 5 years (EPA WaterSense) | 1 to 10 years (Fluidmaster models); none to 5 years (Korky models) |
| Fill valve | No HUD line item | 1 to 7 years (Fluidmaster models); 10 years (Korky 2X Long Life) |
| Wax or wax-free floor seal | No HUD line item | 10 years (Fluidmaster seals) |
| Faucets and valves (for comparison) | 15 years family, 20 years elderly (HUD EUL) | Not compared |
| Any toilet in a rental unit | Same HUD EUL | 1 year on chinaware and mechanical parts (American Standard commercial use, which includes rental units) |
HUD EUL is a capital-planning convention; warranties are commercial terms. Accessed 2026-11-01.
Source: [15][11][26][27][28][29][30] U.S. Department of Housing and Urban Development; U.S. Environmental Protection Agency; American Standard (AS America, Inc.); TOTO U.S.A.; Fluidmaster, Inc.; Korky; Korky
Estimated useful life (EUL): A planning convention HUD uses to schedule replacement reserves for multifamily buildings. It is not a measured survival curve, and single-family use can differ.
EPA's own savings figures imply a toilet life: more than $170 a year and $3,400 over the lifetime of the toilets works out to about 20.0 years, an upper bound because the annual figure is a minimum (EPA WaterSense, Residential Toilets; KBR calculation d9).
One-bathroom homes lose every working toilet 3.2 times as often
The survey question behind this finding counts only moments when every toilet in the home was out at once, so a second toilet is a backup that a one-bath home does not have.
In the American Housing Survey 2023 public use file, 3.31% of households in homes with one full bath reported that all their flush toilets stopped working at some time in the three months before the interview, against 1.03% of households with 1.5 baths or more (KBR tabulation of 48,498 occupied sample homes).
The ratio is 3.21, with a replicate-weight standard error of 0.29, and the gap is 2.28 percentage points with a standard error of 0.19 (KBR calculations d1 and d2 using the 160 Fay replicate weights HUD and the Census Bureau prescribe).
All flush toilets not working at some time in the last 3 months, US, 2023
Source: KBR tabulation of U.S. Census Bureau and HUD, American Housing Survey 2023 PUF v1.1 (NOTOIL, BATHROOMS)
Homes with one full bath or fewer held 30.3% of US households with a flush toilet in 2023 but 58.2% of the households that lost every toilet (KBR calculation d3).
| Bathrooms in home | Households (thousands) | Lost all toilets (thousands) | Lost all toilets (%) | 90% MOE (pp) | Outage of 6+ hours (%) | Sample cases |
|---|---|---|---|---|---|---|
| 1 full bath | 40283.2 | 1332.3 | 3.31 | 0.29 | 2.38 | 633 |
| 1.5 baths | 13911.3 | 249.3 | 1.79 | 0.47 | 1.32 | 88 |
| 2 full baths | 42606.9 | 455.4 | 1.07 | 0.18 | 0.97 | 153 |
| 2.5 baths | 18193.6 | 111.1 | 0.61 | 0.2 | 0.53 | 43 |
| 3 or more full baths | 18101.2 | 139.4 | 0.77 | 0.23 | 0.63 | 38 |
| One full bath or fewer | 40295.5 | 1332.3 | 3.31 | 0.29 | 2.38 | 633 |
| 1.5 baths or more | 92813.0 | 955.1 | 1.03 | 0.12 | 0.87 | 322 |
| All households with a flush toilet | 133108.5 | 2287.4 | 1.72 | 0.12 | 1.33 | 955 |
Signature table. 90% MOE from 160 Fay replicate weights. Group 'one full bath or fewer' adds 7 sample homes with a toilet but no full bath.
Source: [1][21] U.S. Census Bureau and HUD; HUD and U.S. Census Bureau
Renting explains part of the gap, not all of it: owners with one bath run 2.85 times the risk
Renters report all-toilet outages about three times as often as owners, and one-bath homes are more often rented, so tenure is the obvious confounder to test.
Across all homes, 3.02% of renter households and 1.02% of owner households lost every toilet at some point in the three months before their 2023 interview (American Housing Survey 2023, KBR tabulation).
Among owners alone, 2.25% of one-bath households lost all toilets against 0.79% of owners with 1.5 baths or more, a ratio of 2.85. Among renters, the shares were 3.86% and 1.91%, a ratio of 2.02 (KBR calculation d4).
Share that lost all toilets in the last 3 months, US, 2023
Source: KBR tabulation of American Housing Survey 2023 PUF v1.1 (NOTOIL, BATHROOMS, TENURE)
The bathroom gap survives within each tenure group, which points to the missing backup toilet itself, though the AHS cannot separate that from older plumbing and building type in one-bath homes.
Homes built before 1940 report all-toilet outages at 2.46 times the rate of 2000s homes
Outage rates fall with the age of the house, from 2.29% in homes built in 1939 or earlier to under 1% in homes built since 2000.
In the American Housing Survey 2023, 2.29% of households in homes built in 1939 or earlier lost all toilets in the three-month window, compared with 0.93% in homes built from 2000 to 2009 and 0.99% in homes built from 2010 to 2023.
Share of households, last 3 months, US, 2023
Source: KBR tabulation of American Housing Survey 2023 PUF v1.1 (NOTOIL, YRBUILT)
| Year home was built | Households (thousands) | Lost all toilets (thousands) | Lost all toilets (%) | 90% MOE (pp) | Sample cases |
|---|---|---|---|---|---|
| 1939 or earlier | 16222.7 | 372.3 | 2.29 | 0.39 | 146 |
| 1940 to 1959 | 18037.0 | 382.4 | 2.12 | 0.34 | 177 |
| 1960 to 1979 | 32415.3 | 648.4 | 2.0 | 0.28 | 288 |
| 1980 to 1999 | 33679.4 | 570.3 | 1.69 | 0.22 | 220 |
| 2000 to 2009 | 17733.1 | 165.1 | 0.93 | 0.24 | 73 |
| 2010 to 2023 | 15021.0 | 148.9 | 0.99 | 0.3 | 51 |
Year built is the home's, not the toilet's.
Source: [1] U.S. Census Bureau and HUD
The AHS records the year the home was built, not the year the toilet was installed, so this gradient describes old buildings, which also tend to have fewer bathrooms and older drain lines. For the age of the housing stock itself, see How old is my house?.
Since 2017 the share losing every toilet has stayed between 1.72% and 1.98%
Four AHS rounds show no clear trend: between 2.1 million and 2.5 million households lose every working toilet in a 3-month window, most of them for 6 hours or more.
Census Table Creator counts put households with no toilet working at some time in the last three months at 2,318 thousand in 2017, 2,130 thousand in 2019, 2,545 thousand in 2021 and 2,287 thousand in 2023 (AHS Table C-05-AO, 2017 to 2023).
As shares of households with a flush toilet, those counts are 1.91%, 1.72%, 1.98% and 1.72%. The 2023 count carries a 90% margin of error of 162 thousand, so year-to-year moves are close to sampling noise (KBR calculation d6).
Share of US households with a flush toilet, last 3 months
Source: U.S. Census Bureau, AHS Table C-05-AO for 2017, 2019, 2021 and 2023; shares computed by KBR
| AHS year | Households with a flush toilet (thousands) | No toilet working at some time (thousands) | 90% MOE (thousands) | Share (%) | Outage of 6+ hours (thousands) | Outage of 6+ hours (%) |
|---|---|---|---|---|---|---|
| 2017 | 121400 | 2318 | 142 | 1.91 | 1791 | 1.48 |
| 2019 | 124045 | 2130 | 130 | 1.72 | 1595 | 1.29 |
| 2021 | 128383 | 2545 | 166 | 1.98 | 2031 | 1.58 |
| 2023 | 133109 | 2287 | 162 | 1.72 | 1765 | 1.33 |
Counts and MOE from Table C-05-AO; shares and 6-hour totals computed by KBR.
Source: [2][3][4][5] U.S. Census Bureau; U.S. Census Bureau; U.S. Census Bureau; U.S. Census Bureau
In 2023, 1.76 million households, 1.33% of those with a flush toilet, had at least one all-toilet outage lasting 6 consecutive hours or more; another 522 thousand lost all toilets only for shorter spells (KBR tabulation; AHS Table C-05-AO).
From 6 gallons to 1.28: what each flush rule means per 1,000 flushes
A toilet that outlives its parts can also outlive the water rules it was built under, which is the main reason old but working toilets get replaced.
Federal law caps gravity tank toilets made after January 1, 1994 at 1.6 gallons per flush, with a 3.5 gpf allowance for blowout toilets (42 U.S.C. 6295(k)). DOE's rule extended the 1.6 gpf cap to flushometer valve toilets made after January 1, 1997 (10 CFR 430.32(q)).
EPA says older, inefficient toilets use as much as 6 gallons per flush, while WaterSense labeled toilets use 1.28 gpf or less, 20 percent below the federal standard (EPA WaterSense).
Rated maximum flush volume
Sources: EPA WaterSense; 42 U.S.C. 6295(k); California Energy Commission RFI, March 2026
| Flush rule or toilet type | Gallons per flush | Gallons per 1,000 flushes | Comparison with a 1.28 gpf toilet |
|---|---|---|---|
| Older toilet (EPA: as much as) | 6.0 | 6000 | 78.7% less water with a 1.28 gpf toilet |
| Blowout toilet cap (federal) | 3.5 | 3500 | 63.4% less water with a 1.28 gpf toilet |
| Federal cap since 1994 | 1.6 | 1600 | 20.0% less water with a 1.28 gpf toilet |
| WaterSense (since 2007) | 1.28 | 1280 | Reference |
| CEC long-term option | 1.1 | 1100 | 14.1% less water than 1.28 gpf |
Rated volumes. 1.1 gpf is a California option under study, not a rule.
Source: [7][9][12][20] U.S. Government Publishing Office (govinfo); U.S. Environmental Protection Agency; U.S. Environmental Protection Agency; California Energy Commission
Per 1,000 flushes, a 6 gpf toilet uses 6,000 gallons and a 1.28 gpf toilet 1,280, a 78.7% cut; against a 1994-era 1.6 gpf toilet the cut is 20.0% (KBR calculation d10). Household water use per person is covered in Average water usage per person.
EPA puts the toilet share of an average home's indoor water use at nearly 30 percent on its web page and nearly 25 percent in its May 2024 fact sheet; ASAP cites 26% from a 2016 Water Research Foundation study. The three figures are not reconciled by their publishers.
Twelve states and DC set limits below 1.6 gpf, and California is weighing 1.1
The federal 1.6 gpf cap has not changed since 1994; tighter limits come from states and from EPA's voluntary WaterSense label.
ASAP counts 12 states (California, Texas, Georgia, Colorado, Washington, Nevada, New York, New Jersey, Massachusetts, Rhode Island, Maine and Maryland) plus Washington, DC with toilet standards stricter than the national requirement, 13 jurisdictions in all (ASAP fact sheet, July 2024).
Statute text confirms four of them: Texas caps toilets sold from January 1, 2014 at 1.28 gpf (H.B. 2667); New York caps water closets at 1.28 gpf (ECL 15-0314, Internet Archive copy of the NY Senate page); Washington adopts California's Title 20 water closet standard (RCW 19.260.040); Colorado bars the sale of water closets that are not WaterSense-listed (C.R.S. 6-7.5-105).
On 2026-03-20 the California Energy Commission asked for comment on separate dual-flush limits of 1.28 gpf full and 0.9 gpf reduced, which staff estimate would save 2.9 billion gallons a year after full stock turnover, and on long-term options such as a 1.1 gpf single-flush cap worth 11.6 to 23.5 billion gallons a year (CEC RFI, Docket 22-AAER-05).
Chinaware warranties run for life; the parts that fail carry 1 to 10 years
Manufacturer warranties track the same split as HUD's useful-life table: long cover on the china, short and model-specific cover on the moving parts.
American Standard's 2025 toilet warranty gives a lifetime warranty on chinaware for residential use, with 2, 5 or 10 years on mechanical parts depending on the product line; commercial use, which the warranty defines to include apartments and other rental units, gets 1 year on both (American Standard warranty).
TOTO's one-year limited warranty applies to select vitreous china, and its lifetime limited warranty covers select faucets, cast iron tubs and accessories rather than toilets (TOTO warranty page, accessed 2026-11-01).
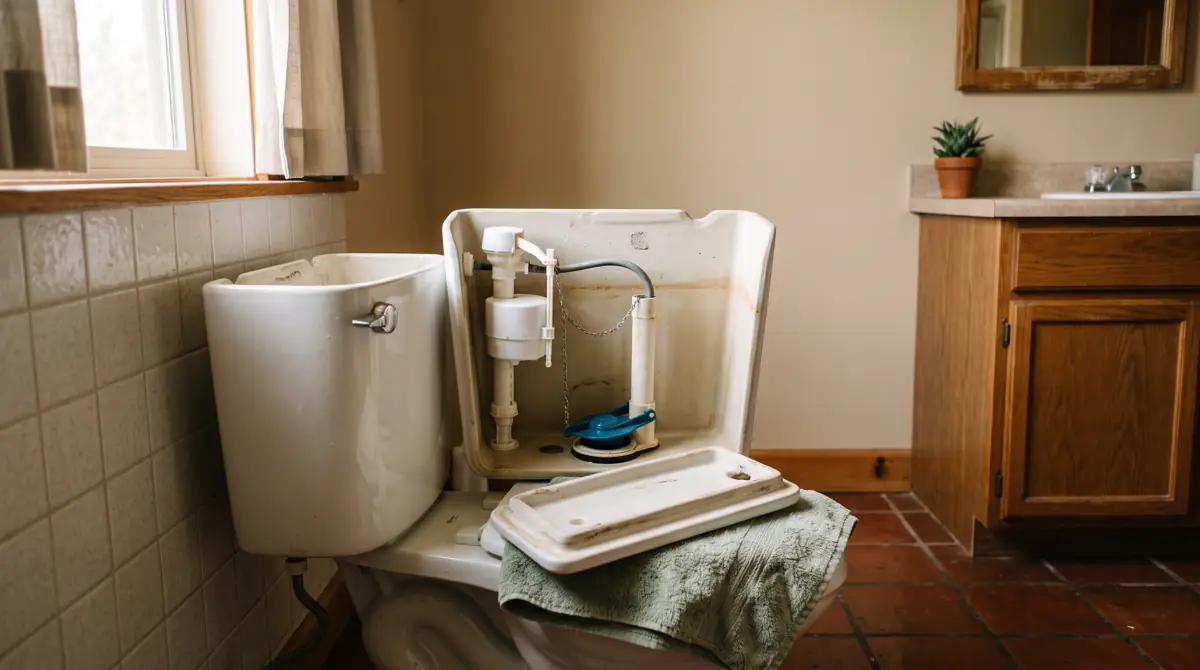
For replacement parts, Fluidmaster lists flapper warranties from 1 to 10 years, fill valve warranties from 1 to 7 years and 10 years on its wax and wax-free floor seals; Korky lists flappers from no warranty to 5 years and a 10-year warranty on its 2X Long Life fill valve (manufacturer warranty pages, accessed 2026-11-01).
Warranty length is a commercial term, not a measured lifespan. These terms are reported as published by each manufacturer; Kohler and Gerber warranty pages could not be retrieved by automated access and are not included.
4.53 million pressure-assist flush units were recalled after reports of bursting
Most toilet parts wear out quietly; the one large failure record in CPSC data involves pressure-assist flushing systems sold inside toilet tanks.
CPSC posted four Flushmate recalls between 2012 and 2018 covering about 4,534,600 US units in total, with 1,755 burst reports and 38 injury reports listed across the notices (CPSC recalls API; KBR calculation d11).
CPSC described the hazard as a vessel that can burst at or near the weld seam, lift the tank lid and shatter the tank. The largest notice, on 2012-06-21, covered about 2,330,600 Flushmate III units made from October 1997 to February 2008.
| Recall date | Product and manufacture window | US units (about) | Burst reports | Injury reports |
|---|---|---|---|---|
| 2012-06-21 | Flushmate III Series 503, made Oct 1997 to Feb 2008 | 2330600 | 304 | 14 |
| 2014-01-23 | Flushmate III Series 503, made Mar 2008 to Jun 2009 | 351000 | 3 | 0 |
| 2016-07-14 | Flushmate III Series 503, made Jul 2009 to Apr 2011 | 453000 | 2 | 1 |
| 2018-10-18 | Flushmate II 501-B, made Sep 1996 to Dec 2013 | 1400000 | 1446 | 23 |
| Total | Four recalls | 4534600 | 1755 | 38 |
Unit counts are CPSC's 'about' figures for the US only.
Source: [16] U.S. Consumer Product Safety Commission
Leaks and water damage from plumbing more broadly are covered in Water damage statistics.
Counts and distributions
relative likelihood of losing all toilets, homes with one full bath or fewer vs 1.5 baths or more (AHS 2023)
Formulashare(one full bath or fewer) / share(1.5 baths or more), each share = sum(WEIGHT x [NOTOIL=1]) / sum(WEIGHT) in the bathroom group; SE from 160 Fay replicates
Inputs: rows 27, 31 (fact sheet rows)
Result: 3.21 (SE 0.29) ratio
A home with one full bath is about three times as likely to be left with no working toilet in a given quarter; the second toilet acts as a backup.
Limitations: Association, not cause: one-bath homes are more often rented, older and smaller; outages include sewer and supply failures
Gap in all-toilet outage share, one full bath or fewer minus 1.5 baths or more
Formulashare(one full bath or fewer) - share(1.5 baths or more)
Inputs: rows 27, 31 (fact sheet rows)
Result: 2.28 (SE 0.19) percentage points
The absolute gap is small per quarter but applies to 40.3 million one-bath households.
Limitations: Same as d1
One-bath homes: share of all households vs share of all households that lost every toilet
Formulahouseholds(one full bath or fewer) / households(all); lost_all(one full bath or fewer) / lost_all(all)
Inputs: rows 26, 28, 1, 2 (fact sheet rows)
Result: 30.3; 58.2 percent; percent
One-bath homes carry nearly twice their share of total-loss outages.
Limitations: Group includes 12.3 thousand weighted homes with no full bath but a toilet (7 sample cases, none reported an outage)
Bathroom gap within tenure: owners and renters separately
Formulashare(owner, one bath or fewer) / share(owner, 1.5+); same for renters
Inputs: rows 52, 53, 54, 55 (fact sheet rows)
Result: 2.85; 2.02 ratio (owners; renters)
The gap narrows but persists inside each tenure group, so renting alone does not explain it.
Limitations: Point ratios without replicate SEs; renter 1.5+ cell has 159 sample cases
Homes built 1939 or earlier vs 2000 to 2009: ratio of all-toilet outage shares
Formulashare(built 1939 or earlier) / share(built 2000 to 2009)
Inputs: rows 39, 47 (fact sheet rows)
Result: 2.46 ratio
Older houses lose all toilets more often; the AHS cannot say whether toilets, drains or supply lines are to blame.
Limitations: Home age, not toilet age; older homes also have fewer bathrooms and older drain lines
Share of households losing all toilets, AHS 2017, 2019, 2021, 2023 (published counts)
Formulanone working (thousands) / with one or more flush toilets (thousands)
Inputs: rows 56, 57, 60, 61, 64, 65, 68, 69 (fact sheet rows)
Result: 2017: 1.91; 2019: 1.72; 2021: 1.98; 2023: 1.72 percent
No trend: the quarterly share moves within the published margins of error.
Limitations: Differences between years are within or near the published margins of error
Households with an all-toilet outage of 6 hours or more, AHS 2017 to 2023 (published counts)
Formulasum of households with 1, 2, 3 and 4 or more 6-hour breakdowns; share = sum / households with a flush toilet
Inputs: rows 58, 62, 66, 70 (fact sheet rows)
Result: 2017: 1791 thousand (1.48%); 2019: 1595 thousand (1.29%); 2021: 2031 thousand (1.58%); 2023: 1765 thousand (1.33%) thousand households (percent)
Most total-loss outages last 6 hours or more.
Limitations: Table Creator counts are rounded; the 2023 PUF tabulation gives 1764.9 thousand
Flush valve replacements implied over one toilet life (HUD EUL)
FormulaEUL toilet / EUL flush valve
Inputs: rows 92, 93, 94 (fact sheet rows)
Result: 4.0 (family); 2.67 (elderly) replacement cycles
Over a 40-year fixture life, HUD's table schedules the flush valve to be replaced several times.
Limitations: Planning conventions for multifamily properties; single-family use rates differ
Toilet life implied by EPA's WaterSense savings figures
Formulalifetime dollar savings / annual dollar savings
Inputs: rows 86, 85 (fact sheet rows)
Result: 20.0 years
EPA's savings arithmetic is consistent with a toilet life of about two decades, half HUD's 40-year planning figure.
Limitations: EPA does not state the lifetime it assumes; the annual figure is 'more than $170', so the implied life is an upper bound and ignores price changes
Water per 1,000 flushes and cut vs a 1.28 gpf toilet
Formulagpf x 1,000; 1 - 1.28 / gpf
Inputs: rows 80, 74, 73, 76, 118 (fact sheet rows)
Result: Older toilet (EPA: as much as): 6000 gal, 78.7%; Blowout toilet cap (federal): 3500 gal, 63.4%; Federal cap since 1994: 1600 gal, 20.0%; CEC option 1.1 gpf: 14.1% below 1.28 gallons; percent
Replacing a 6 gpf toilet cuts flush water by more than three quarters; replacing a 1.6 gpf toilet cuts it by a fifth.
Limitations: Rated volumes; real flushes vary with tank adjustment, leaks and double flushing
Flushmate pressure-assist recalls 2012 to 2018: total US units, burst reports, injury reports
Formulasum over four CPSC recall notices
Inputs: 106, 107, 108, 109 (fact sheet rows)
Result: 4534600; 1755; 38 units; reports; reports
Pressure-assist recalls are the main recorded case of a toilet part failing in a hazardous way.
Limitations: Unit counts are 'about' figures; reports are as of each notice
Jurisdictions with toilet limits stricter than federal
Formula12 states + District of Columbia
Inputs: row 114 (fact sheet rows)
Result: 13 jurisdictions
Tighter limits are a state matter; the federal cap is unchanged since 1994.
Limitations: ASAP count as of July 2024
Key findings
- HUD's capital needs assessment table gives toilets, bidets and urinals a 40-year estimated useful life in family and elderly properties (HUD CNA e-Tool EUL table, 2017).[15]
- HUD gives flush valves a 10-year useful life in family properties and 15 years in elderly properties (HUD, 2017).[15]
- EPA advises replacing toilet flappers at least every five years because the rubber seal wears out (EPA WaterSense, accessed 2026-11-01).[11]
- In the 2023 American Housing Survey, 1.72% of US households with a flush toilet, 2.29 million, had all toilets out of service at some time in the previous 3 months.[1][2]
- In 2023, 1.76 million US households (1.33%) had at least one all-toilet outage lasting 6 hours or more (AHS 2023, KBR tabulation).[1]
- Households with one full bath lost all toilets at 3.31% in the 3 months before their 2023 AHS interview, against 1.03% for homes with 1.5 baths or more, a ratio of 3.21 (KBR analysis).[1]
- Homes with one full bath or fewer were 30.3% of US households with a toilet in 2023 but 58.2% of households that lost every toilet (KBR analysis of AHS 2023).[1]
- Among owner households in 2023, one-bath homes lost all toilets at 2.25% vs 0.79% for homes with 1.5 baths or more (AHS 2023, KBR analysis).[1]
- Households in US homes built in 1939 or earlier lost all toilets at 2.29% in 2023, against 0.93% in homes built 2000 to 2009 (AHS 2023).[1]
- The share of US households losing every toilet was 1.91% in 2017, 1.72% in 2019, 1.98% in 2021 and 1.72% in 2023 (AHS Table C-05-AO).[2][3][4][5]
- Toilets manufactured for the US market after January 1, 1994 may use no more than 1.6 gallons per flush, or 3.5 for blowout toilets (42 U.S.C. 6295(k)).[7]
- EPA says older US toilets use as much as 6 gallons per flush and WaterSense models 1.28 gpf or less (EPA WaterSense, 2026).[9]
- Twelve states plus Washington, DC had toilet standards stricter than the national 1.6 gpf limit as of July 2024 (ASAP).[24]
- American Standard's 2025 residential toilet warranty covers chinaware for life and mechanical parts for 2, 5 or 10 years by product line.[26]
- CPSC's four Flushmate pressure-assist recalls from 2012 to 2018 covered about 4,534,600 US units and listed 1,755 burst reports (KBR sum of CPSC notices).[16]
Executive summary
- HUD assigns toilets a 40-year estimated useful life but flush valves only 10 years in family housing, about 4.0 valve replacements per toilet life (HUD CNA e-Tool, 2017).
- EPA says to replace a toilet flapper at least every five years; worn flappers cause most toilet leaks (EPA WaterSense, 2026).
- In 2023, 2.29 million US households, 1.72% of those with a flush toilet, had every toilet out at some time in the prior 3 months (AHS 2023).
- Homes with one full bath or fewer lost every toilet at 3.31%, 3.2 times the 1.03% rate in homes with more baths; they hold 30.3% of homes but 58.2% of outages (KBR analysis of AHS 2023 microdata).
- The gap holds within tenure: 2.85 times for owners and 2.02 times for renters (AHS 2023).
- The share has stayed between 1.72% and 1.98% across the 2017, 2019, 2021 and 2023 surveys (AHS Table C-05-AO).
- The federal cap has been 1.6 gpf since 1994; 12 states and DC go lower, and California is studying 1.1 gpf (42 U.S.C. 6295(k); ASAP 2024; CEC 2026).
- American Standard warrants residential chinaware for life but mechanical parts for 2, 5 or 10 years; Fluidmaster flapper warranties run 1 to 10 years (manufacturer documents, 2025 to 2026).
Questions people ask
When should a toilet be replaced?
No federal rule sets a replacement age. HUD's planning table uses 40 years for the fixture and 10 years for the flush valve in family housing, so most wear is in parts that can be swapped. EPA's case for replacement is water: a toilet from before the 1994 federal limit can use as much as 6 gallons per flush against 1.28 for a WaterSense model, saving a home nearly 13,000 gallons a year by EPA's estimate. This page is information, not advice for a specific toilet.
How long does a toilet flapper last?
EPA says the flapper should be checked periodically and replaced at least every five years. Warranties vary widely by model: Fluidmaster lists 1 to 10 years for its flappers and Korky lists anything from no warranty to 5 years (accessed 2026-11-01).
Do old toilets use more water?
Yes. EPA says older toilets use as much as 6 gallons per flush. Per 1,000 flushes that is 6,000 gallons, against 1,600 for a 1994-era 1.6 gpf toilet and 1,280 for a 1.28 gpf WaterSense toilet, a cut of 78.7% from the oldest models (KBR calculation from EPA and federal limits).
Are low flow toilets required?
Toilets made for sale in the US since January 1, 1994 must meet the federal 1.6 gpf limit (42 U.S.C. 6295(k)). Twelve states and Washington, DC set stricter limits, typically 1.28 gpf, as of July 2024 (ASAP). These rules govern new toilets sold or installed; this report found no federal rule requiring existing working toilets to be removed.
Frequently asked questions
How long does the porcelain part of a toilet last?
HUD's capital planning table assigns toilets, bidets and urinals a 40-year estimated useful life in both family and elderly properties (HUD CNA e-Tool, 2017).
How long does a toilet flush valve last?
HUD uses 10 years in family properties and 15 years in elderly properties, where use is lighter (HUD CNA e-Tool, 2017).
How often do US households lose every working toilet?
In 2023, 1.72% of US households with a flush toilet, 2.29 million, had all toilets out at some time in the prior 3 months (American Housing Survey 2023).
Are homes with one bathroom more likely to be left without a toilet?
Yes. In 2023, 3.31% of one-full-bath households lost every toilet in 3 months against 1.03% of homes with 1.5 baths or more, 3.2 times as often (KBR analysis of AHS 2023 microdata).
How long do toilet outages last?
Of the 2.29 million households that lost all toilets in 2023, 1.76 million had at least one outage lasting 6 hours or more (AHS 2023).
What is the federal flush limit for toilets?
1.6 gallons per flush for gravity tank, flushometer tank and electromechanical toilets made after January 1, 1994, and 3.5 for blowout toilets (42 U.S.C. 6295(k)).
What does a WaterSense label mean for a toilet?
The toilet is independently certified to use 1.28 gallons per flush or less, 20 percent below the federal limit, and to pass EPA's flushing performance tests (EPA WaterSense, 2026).
How much water does replacing an old toilet save?
EPA estimates nearly 13,000 gallons a year per home and more than $170 a year in water costs when old toilets are replaced with WaterSense models (EPA WaterSense, 2026).
Which states have stricter toilet laws than the federal limit?
California, Texas, Georgia, Colorado, Washington, Nevada, New York, New Jersey, Massachusetts, Rhode Island, Maine and Maryland, plus Washington, DC, as of July 2024 (ASAP).
Do toilet warranties cover the whole toilet for life?
Not usually. American Standard warrants residential chinaware for life but mechanical parts for 2, 5 or 10 years, and 1 year in rental units; TOTO's one-year warranty applies to select vitreous china (manufacturer documents, 2025 to 2026).
Download the data
Every table in this report is available as a CSV under CC BY 4.0. The fact sheet lists each value with its source URL and access date.
- derived_metrics.csv (CSV)
- fact_sheet.csv (CSV)
- Registry of US toilet flush-volume rules, 1994 to 2026 (CSV)
- Households that lost every toilet in 3 months, by bathrooms in the home (US, 2023) (CSV)
- Households that lost every toilet in 3 months, by year the home was built (US, 2023) (CSV)
- All-toilet outages in AHS rounds 2017 to 2023 (published counts) (CSV)
- Planning life and warranty terms by toilet component (CSV)
- Flush rules and water per 1,000 flushes (CSV)
- Flushmate pressure-assist recalls posted by CPSC, 2012 to 2018 (CSV)
For journalists and researchers
If you cite only a few, cite these
- One-full-bath homes: 3.31% lost all toilets in 3 months vs 1.03% for homes with 1.5+ baths (AHS 2023, KBR analysis).[1]
- 2.29 million US households (1.72%) lost every working toilet at some time in 3 months (AHS 2023).[1][2]
- HUD useful life: toilet 40 years, flush valve 10 years (family housing).[15]
Most quotable statistics
- Homes with one full bath or fewer lost every working toilet 3.2 times as often as homes with more bathrooms in 2023 (3.31% vs 1.03% over 3 months).[1]
- One-bath homes were 30.3% of US households in 2023 but 58.2% of households left with no working toilet.[1]
- About 2.29 million US households had every toilet out of service at some point in a 3-month window in 2023.[1][2]
- HUD plans for a toilet to last 40 years and its flush valve 10.[15]
- EPA advises replacing toilet flappers at least every five years.[11]
- The federal 1.6 gpf toilet limit has stood since 1994; 12 states and DC have gone lower.[7][24]
Press summary
A Kitchen and Bath Renovators analysis of the 2023 American Housing Survey finds that homes with one full bathroom or fewer were 3.2 times as likely as larger homes to lose every working toilet. Over a 3-month window, 3.31% of one-bath households reported that all their toilets were out at once, against 1.03% of homes with 1.5 baths or more. One-bath homes made up 30.3% of households but 58.2% of the 2.29 million households left without a working toilet. The gap holds for owners (2.85 times) and renters (2.02 times). The report pairs the survey data with HUD's planning lives, 40 years for the toilet and 10 for its flush valve, EPA's advice to replace flappers at least every five years, and a dated registry of flush limits: 1.6 gallons per flush federally since 1994, 1.28 in 12 states and DC, and a 1.1 option now under study in California.
Suggested headlines
- One-bathroom homes lose every working toilet 3.2 times as often, federal survey shows
- 2.29 million US households went without a working toilet in a 3-month span
- HUD plans 40 years for a toilet but 10 for its flush valve
- Twelve states and DC now cap toilets below the federal 1.6 gallons
- California weighs a 1.1 gallon toilet as federal limit holds at 1994 level
How to cite this report
Kitchen and Bath Renovators. (2026). How Long Do Toilets Last? Flush Rules, Breakdowns and Parts. Retrieved from https://kitchenandbathrenovators.com/research/how-long-do-toilets-last/
Reuse license
Data and tables are licensed CC BY 4.0. Attribution: “Source: Kitchen and Bath Renovators, How Long Do Toilets Last? Flush Rules, Breakdowns and Parts” with a link to this page.
Reproduce this analysis
Every figure comes from the files below. The scripts that pulled and computed them are kept with the report and can be re-run.
| Dataset | Publisher | Source | Query or filter | Rows used | Retrieved |
|---|---|---|---|---|---|
| American Housing Survey 2023 National PUF v1.1 (household.csv) | U.S. Census Bureau and HUD | File or endpoint | INTSTATUS='1' and BATHROOMS in (01-06, 08, 09, 12); NOTOIL='1'; NOTOILFREQ>=1; by BATHROOMS, YRBUILT, TENURE; WEIGHT and REPWEIGHT1-160 | 48,498 of 55,669 household records | 2026-11-01 |
| AHS Table Specifications and PUF Estimates for User Verification, 2017, 2019, 2021, 2023 (Housing Quality sheet) | U.S. Census Bureau | File or endpoint | Rows under 'Flush Toilet Breakdowns', Table Creator estimate and MOE columns | 9 rows per year, 4 years | 2026-11-01 |
| CPSC Recalls API | U.S. Consumer Product Safety Commission | File or endpoint | RecallTitle=flushmate; also ProductName=toilet (5 results, none a toilet failure) | 4 recalls | 2026-11-01 |
| HUD CNA e-Tool Estimated Useful Life Table | HUD | File or endpoint | Components 3.4.1.3.1 to 3.4.1.3.7 (plumbing fixtures) | 5 line items | 2026-11-01 |
| 10 CFR 430.32 via eCFR renderer API | Office of the Federal Register | File or endpoint | Paragraph (q) Water closets | 5 water closet types | 2026-11-01 |
Data quality and exclusions
- Household file: 55,669 records; 7,142 vacant or usual-residence-elsewhere interviews removed (no toilet questions asked).
- 29 occupied records with no flush toilet removed, leaving 48,498 records, the Census C-05-AO universe.
- NOTOIL had no not-reported values inside the universe: 955 records answered yes and 47,543 no.
- NOTOILFREQ is top-coded at 8 or more (81 records); it is used only as 1 or more, so the top code does not affect estimates.
- The group with a toilet but no full bath has 7 sample records and no reported outages; it is folded into 'one full bath or fewer' and not shown on its own.
- Year built uses the PUF's banded YRBUILT; single years 2010 to 2023 were grouped into one band (4,659 records).
- The Table Creator estimate column was used for all four survey years; for 2017 it is rounded to 4 significant digits (the PUF column differs by less than 1 thousand).
Methodology
Source selection: federal statute and regulation text, EPA WaterSense documents, HUD's capital needs useful-life table, CPSC recall records and the Census and HUD American Housing Survey were preferred. State limits come from statute text where an official or archived copy could be opened, and otherwise from the Appliance Standards Awareness Project timeline, labelled as a secondary compilation. Manufacturer warranties are taken from each company's own warranty document.
AHS tabulation: the 2023 national PUF v1.1 household file (55,669 records) was filtered to occupied interviews with at least one flush toilet (BATHROOMS 01 to 06, 08, 09, 12), matching Census table specification C-05-AO; 48,498 records remain. Estimates use WEIGHT; standard errors use the 160 replicate weights with the Fay BRR formula from the HUD and Census quick guide. The national count of 2,287.4 thousand households losing all toilets matches the published Table Creator value of 2,287 thousand.
Derived metrics: ratios and shares are computed from summed weighted numerators and denominators, never from averaged rates. Each formula and its fact sheet rows are listed in derived_metrics.csv; the AHS script is in scripts/ahs_toilets.py.
Conflicts: EPA gives the toilet share of indoor water use as nearly 30 percent on its web page and nearly 25 percent in its May 2024 fact sheet; ASAP cites 26%. All three are shown, none is used in a calculation.
Exclusions: the WaterSense product list download and the DOE certification database require an API key or returned HTTP 403, so no count of certified models is given. Pages that blocked automated access are listed in excluded.md.
Not advice: this report describes rules, survey results and warranty terms. It is not plumbing, legal or purchasing advice. Last updated 2026-11-01.
This report presents published data with its limitations. It is not legal, financial or investment advice.
Sources, ranked by quality
Tier 1: primary and official sources (22)
- [1] U.S. Census Bureau and HUD. American Housing Survey 2023 National Public Use File v1.1 (household.csv). 2023 (released 2025-01-22, v1.1). Accessed 2026-11-01.
- [2] U.S. Census Bureau. AHS 2023 Table Specifications and PUF Estimates for User Verification (Table C-05-AO Housing Quality). 2023. Accessed 2026-11-01.
- [3] U.S. Census Bureau. AHS 2021 Table Specifications and PUF Estimates for User Verification. 2021. Accessed 2026-11-01.
- [4] U.S. Census Bureau. AHS 2019 Table Specifications and PUF Estimates for User Verification. 2019. Accessed 2026-11-01.
- [5] U.S. Census Bureau. AHS 2017 Table Specifications and PUF Estimates for User Verification. 2017. Accessed 2026-11-01.
- [6] U.S. Census Bureau and HUD. 2023 AHS Definitions (Flush toilet and flush toilet breakdowns). 2023. Accessed 2026-11-01.
- [7] U.S. Government Publishing Office (govinfo). 42 U.S.C. 6295(k), Standards for water closets and urinals (United States Code, 2023 edition). Law of 1992, in force since 1994. Accessed 2026-11-01.
- [8] Office of the Federal Register (eCFR). 10 CFR 430.32(q), Water closets (eCFR, current). Current as of 2026-11-01. Accessed 2026-11-01.
- [9] U.S. Environmental Protection Agency. WaterSense: Residential Toilets. Page current 2026-11-01. Accessed 2026-11-01.
- [10] U.S. Environmental Protection Agency. WaterSense Labeled Toilets fact sheet (EPA 832-F-24-008). May 2024. Accessed 2026-11-01.
- [11] U.S. Environmental Protection Agency. WaterSense: Fix a Leak Week. Page current 2026-11-01. Accessed 2026-11-01.
- [12] U.S. Environmental Protection Agency. WaterSense Specification for Tank-Type Toilets, Version 1.2. Effective 2014-06-02. Accessed 2026-11-01.
- [13] U.S. Environmental Protection Agency. WaterSense Specification for Tank-Type Toilets, Version 2.0. May 2024 (effective date paused). Accessed 2026-11-01.
- [14] U.S. Environmental Protection Agency. Summary of Revisions to the WaterSense Specification for Tank-Type Toilets (Version 1.2). 2014. Accessed 2026-11-01.
- [15] U.S. Department of Housing and Urban Development. CNA e-Tool Estimated Useful Life Table. PDF created 2017-05-30. Accessed 2026-11-01.
- [16] U.S. Consumer Product Safety Commission. CPSC Recalls API, Flushmate recalls (2012, 2014, 2016, 2018). 2012 to 2018. Accessed 2026-11-01.
- [17] Texas Legislature. Texas H.B. 2667, 81st Legislature (enrolled), amending Health and Safety Code ch. 372. Enacted 2009. Accessed 2026-11-01.
- [18] New York State Senate (via Internet Archive). New York Environmental Conservation Law 15-0314 (Internet Archive capture of the NY Senate page; live page returned HTTP 403 to automated access). Text as captured in 2024. Accessed 2026-11-01.
- [19] Washington State Legislature. RCW 19.260.040, Minimum efficiency standards (Washington). Current (2019 c 286, 2022 c 19). Accessed 2026-11-01.
- [20] California Energy Commission. Request for Information: Appliance Efficiency Regulations for Water Closets, Docket 22-AAER-05, TN 269259. Docketed 2026-03-20. Accessed 2026-11-01.
- [21] HUD and U.S. Census Bureau. Quick Guide to Estimating Variance Using Replicate Weights: 2009 to Current. Updated May 2021. Accessed 2026-11-01.
- [22] U.S. Census Bureau. AHS 2023 National PUF Versioning Document. v1.0 2024-09-25, v1.1 2025-01-22. Accessed 2026-11-01.
Tier 2: trade bodies, market research, company data (8)
- [23] Appliance Standards Awareness Project (ASAP). Toilets (product page and state adoption timeline). Page current 2026-11-01. Accessed 2026-11-01.
- [24] Appliance Standards Awareness Project (ASAP). Water Efficiency Standards for Toilets, fact sheet. July 2024. Accessed 2026-11-01.
- [25] Appliance Standards Awareness Project. Comments on the CEC RFI for water closets (ASAP, CFA, NCLC). 2026-05-05. Accessed 2026-11-01.
- [26] American Standard (AS America, Inc.). Lifetime Limited Warranty, Toilets and Toilet Seats (2025). 2025. Accessed 2026-11-01.
- [27] TOTO U.S.A.. Warranty information. Page current 2026-11-01. Accessed 2026-11-01.
- [28] Fluidmaster, Inc.. Warranty (product warranty table). Page current 2026-11-01. Accessed 2026-11-01.
- [29] Korky. Warranty (product warranty list). Page current 2026-11-01. Accessed 2026-11-01.
- [30] Korky. 2X Long Life Toilet Fill Valve product page. Page current 2026-11-01. Accessed 2026-11-01.
Tier 3: journalism and expert commentary (1)
- [31] Colorado.Public.Law. C.R.S. 6-7.5-105, Standards (unofficial publisher copy of the Colorado Revised Statutes). Current text. Accessed 2026-11-01.