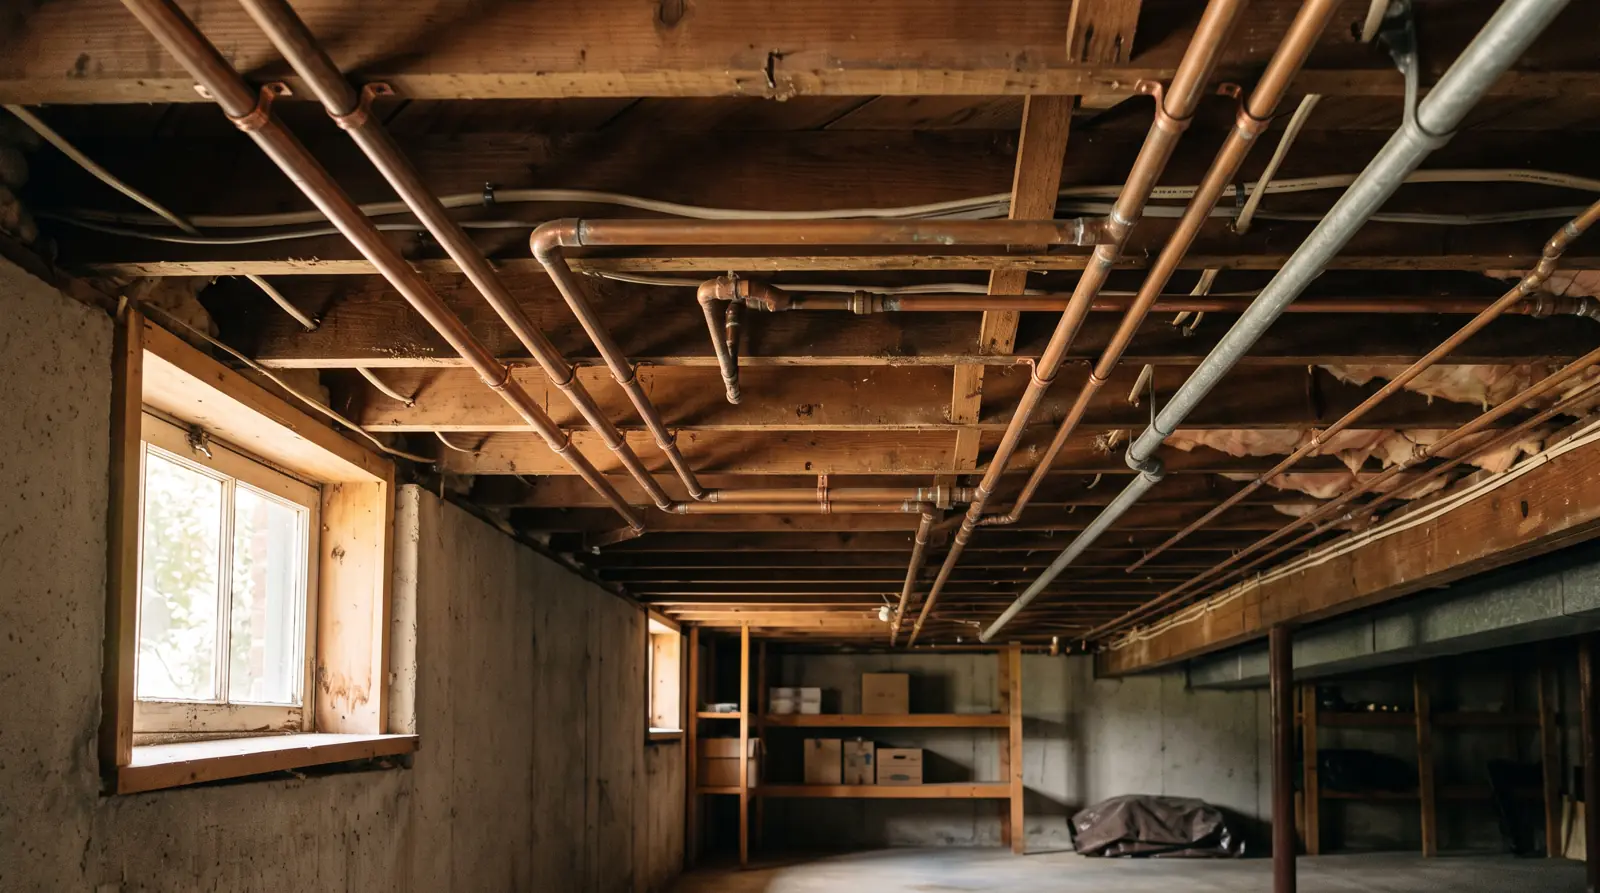
How Long Do Copper Pipes Last? Pipe Lifespans by Material and Water
- Primary data
- EPA Safe Drinking Water Information System (SDWIS) Lead and Copper Rule sample results, via Envirofacts
- Data period
- Tap sampling periods ending 2023-01-01 to 2025-12-31 (trend from 2016)
- Latest release used
- 2026-11-01 (Envirofacts tables retrieved; states report to EPA quarterly)
- Next release
- Quarterly state reporting under 40 CFR 142.15; LCRI compliance date November 1, 2027
- Geography
- 50 states and DC
- Sources
- 25 (18 Tier 1)
Fannie Mae's 50-year useful life for hot and cold water piping is the best-sourced answer to how long do copper pipes last, and it is not copper-specific. Water chemistry moves it: in periods ending 2023 to 2025, 620 US community water systems (1.49% of those sampled) exceeded EPA's 1.3 mg/L copper action level.
How the index is built
Copper action level exceedance share, periods ending 2023 to 2025
Formulasystems with CU90 > 1.3 mg/L (and <= 10 mg/L) / active CWS with any PB90 or CU90 result x 100
Inputs: fact rows 2, 4; derived_metrics d1 (fact sheet rows)
Result: 620 / 41,567 = 1.49%
Roughly 1.5 in every 100 sampled community water systems were required to act on copper in the latest three complete years.
Limitations: SDWIS completeness varies by state; 6,496 active systems have no result in the window, partly because of 9-year waivers.
Population on systems over the copper action level
Formulasum of SDWIS population served for the 620 systems / sum for the 41,567 sampled systems x 100
Inputs: fact rows 6, 7 (fact sheet rows)
Result: 1,090,350 / 311,520,941 = 0.35%
Copper exceedances touch a small share of people because they concentrate in small systems.
Limitations: Population is the current SDWIS figure; wholesale and consecutive systems can double count people.
Small-system share of exceeders
Formulaexceeders serving 3,300 or fewer / all exceeders x 100
Inputs: fact rows 4, 12 (fact sheet rows)
Result: 548 / 620 = 88.4%
Copper corrosion control problems sit mostly with small utilities, the same group eligible for 9-year monitoring waivers.
Limitations: Small systems are also the most numerous: 32,459 of 41,567 sampled systems serve 3,300 or fewer.
Groundwater versus surface water exceedance ratio
Formula(516 / 31,392) / (104 / 10,173)
Inputs: fact rows 15 to 18 (fact sheet rows)
Result: 1.64% / 1.02% = 1.61
Groundwater systems exceed about 1.6 times as often, consistent with USGS finding 32% of groundwater sites potentially corrosive.
Limitations: Source code is the system's primary source; treatment, not source alone, sets tap chemistry.
Repeat exceeders
Formula2023 to 2025 exceeders also over in a period ending 2016 to 2022 / 2023 to 2025 exceeders x 100
Inputs: fact rows 4, 8 (fact sheet rows)
Result: 291 / 620 = 46.9%
Nearly half of current exceeders had exceeded before, so the problem is persistent where it occurs.
Limitations: Envirofacts history starts with periods ending 2016.
Trend in yearly exceedance share
Formulashare for periods ending 2025 minus share for periods ending 2016
Inputs: fact rows 24, 25 (fact sheet rows)
Result: 1.59% minus 2.46% = 0.87 percentage points lower
Fewer systems are over the copper action level each year than in 2016.
Limitations: Each year's cohort differs because systems sample on different schedules; late 2025 reports may still arrive.
Age of the 50-year water distribution figure
Formula2026 (current Fannie Mae instructions) minus 1991 (tables developed for Fannie Mae)
Inputs: fact rows for HUD copy and Form 4099 (January 2026) (fact sheet rows)
Result: 35 years
The most-cited lifespan anchor is a budgeting convention that has not been re-estimated against copper performance in the sources reviewed.
Limitations: Only the 1991-developed copy and the 10/14 edition of the tables were checked.
Years of PEX use in North America
Formula2026 minus 1984
Inputs: fact row for PEX introduction year (fact sheet rows)
Result: 42 years
No PEX installation in North America can yet show the 50-year life its test standard extrapolates.
Limitations: Introduction year, not the year PEX became common for home supply lines.
Where the 50-year answer to how long do copper pipes last comes from: a budgeting table, not a copper test
The number behind most copper lifespan claims is a multifamily budgeting standard that covers any supply pipe. No federal or industry dataset opened for this report measures how long copper tube lasts in homes.
Fannie Mae's property condition assessment instructions give "Hot and Cold Water Distribution" an estimated useful life of 50 years and domestic hot water supply and return lines 30 years (Form 4099.F, 10/14). The table does not name copper, PEX or any other material, and Fannie Mae says the values are standardized averages that do not replace a consultant's judgment.
The same 50-year and 30-year values appear in the Fannie Mae tables developed in 1991 by On-Site Insight that HUD attached to its Mark-to-Market inspection statement of work (HUD copy). Fannie Mae's January 2026 instructions still direct consultants to Appendix F, so the figure has carried forward for 35 years.
The other study homeowners meet most often, the NAHB and Bank of America Home Equity Study of Life Expectancy of Home Components (February 2007), has no line for copper, PEX, CPVC or galvanized water supply pipe. Its plumbing rows are concrete and cast iron waste pipe at 100 years; its copper 50+ entry is for gutters (NAHB, 2007).
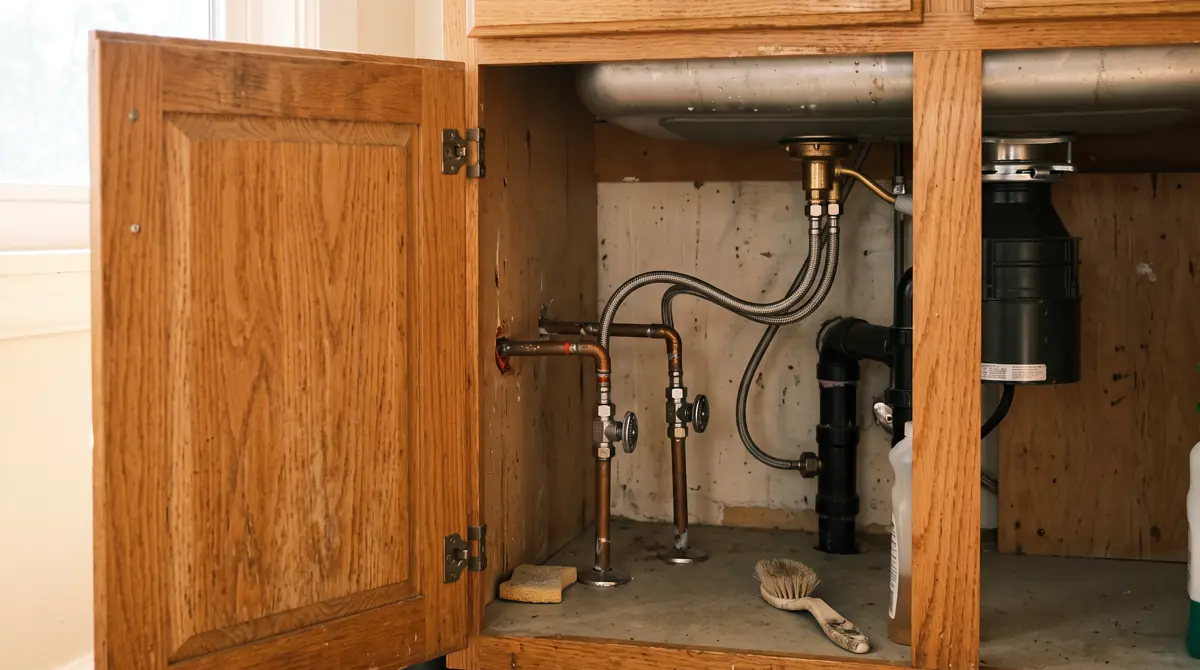
Pipe lifespan index: six materials and what each number actually measures
Only three of the six materials have a sourced figure tied to the material itself, and each comes from a different kind of evidence: a lab extrapolation for PEX, a builder survey of manufacturers for cast iron, and a landscaping table for PVC.
| Material | Typical home use | In North American use since | Best-sourced service-life figure | What that figure measures | Source of figure | What popular pages claim (unsourced) | Main failure mode in the sources |
|---|---|---|---|---|---|---|---|
| Copper tube (Types K, L, M) | Hot and cold supply lines | Installation methods largely unchanged since the 1930s (Maryland task force, 2004) | 50 years | Fannie Mae estimated useful life for multifamily hot and cold water distribution of any material; no copper-specific figure | Fannie Mae Form 4099.F (10/14); same value in the 1991-developed tables HUD used | 50 to 70 years (Bob Vila); over 50 (This Old House); 50 to 70 for water mains (Balkan) | Pitting corrosion that ends in pinhole leaks; copper release into water, higher in new pipe |
| PEX (cross-linked polyethylene) | Hot and cold supply lines | 1984 (first introduced in North America) | 50 years minimum | Extrapolated lifetime required by ASTM F876 in the ASTM F2023 hot chlorinated water test at 140 F and 80 psi; a lab extrapolation, not field data | PEX design guide prepared for PPI, PPFA and HUD's PATH program (2006) | 30 to 50 years (Bob Vila); around 50 (This Old House) | Oxidation by hot chlorinated water; ultraviolet exposure before installation |
| CPVC | Hot and cold supply lines | Not established from an opened source | Not available | No Tier 1 or Tier 2 material-specific figure found; the Fannie Mae 50-year system figure is material-neutral | None | Not covered by the three pages reviewed | Not covered by the sources opened |
| PVC | Cold water, drain and outdoor lines | Not established from an opened source | 25 years | NAHB life expectancy for underground PVC piping, listed in its site and landscaping table, not house plumbing | NAHB and Bank of America Home Equity study (2007) | Around 50 years (This Old House) | Some plastics such as PVC are meant for cold water only (Maryland task force) |
| Galvanized steel | Older supply lines | Not established from an opened source | Not available | No Tier 1 or Tier 2 material-specific figure found; the Fannie Mae 50-year system figure is material-neutral | None | Up to 100 years (This Old House); 20 to 50 for water mains (Balkan) | Zinc coating corrodes first, then the steel (Maryland task force); can hold lead released upstream (EPA, 2016) |
| Cast iron | Drain, waste and vent | Not established from an opened source | 100 years | NAHB life expectancy for cast iron waste pipe; inputs include the Cast Iron Soil Pipe Institute. Fannie Mae lists sanitary waste and vent systems at 50+ years | NAHB and Bank of America Home Equity study (2007); Fannie Mae Form 4099.F | Up to 100 years (This Old House) | Not covered by the sources opened |
Popular-page figures are shown only to compare; none of the three pages names a source. Not available means no Tier 1 or Tier 2 source opened for this report gives a material-specific figure.
Source: [19][18][22][21][13][11][23][24][25] Fannie Mae; U.S. Department of Housing and Urban Development (hosting Fannie Mae tables); NAHB Research Center for PPI, PPFA and HUD's PATH program; National Association of Home Builders / Bank of America Home Equity; State of Maryland, Department of Housing and Community Development; U.S. Environmental Protection Agency; BobVila.com; This Old House; Balkan Sewer and Water Main Service
Years, as published by each source; each bar measures something different (see table t1)
Sources: Fannie Mae Form 4099.F (10/14); NAHB and Bank of America Home Equity (2007); PEX design guide for PPI, PPFA and HUD PATH (2006).
PEX's 50 years is a minimum extrapolated lifetime that ASTM F876 requires in the ASTM F2023 hot chlorinated water test, run at 140 F and 80 psi with about 4.3 ppm free chlorine at pH 6.8. It is a laboratory pass mark, not an observed service life; PEX was first introduced in North America in 1984, 42 years before this report (PEX design guide, 2006). The guide was prepared for two plastic pipe trade groups and HUD's PATH program.
Cast iron's 100 years comes from the NAHB study, whose listed inputs for that table include the Cast Iron Soil Pipe Institute. Fannie Mae's tables put sanitary waste and vent systems at 50+ years. Galvanized steel and CPVC have no material-specific figure in any Tier 1 or Tier 2 source opened here; popular pages put galvanized anywhere from 20 to 50 years to up to 100. Polybutylene has its own report at /research/polybutylene-pipe/.
Estimated useful life: A planning value lenders and assessors use to schedule replacement reserves. It is an average for budgeting, not a guarantee and not a measured failure age.
620 water systems delivered tap water over the copper action level in 2023 to 2025
Copper in tap water is the one large, national, repeated measurement tied to copper plumbing. KBR counted every community water system whose copper 90th percentile exceeded 1.3 mg/L in tap sampling periods ending 2023 to 2025.
Of 48,063 active community water systems in the 50 states and DC, 41,567 have at least one lead or copper 90th percentile result in SDWIS for a period ending 2023 to 2025. Of those, 620 (1.49%) had a copper 90th percentile above 1.3 mg/L at least once. They serve 1,090,350 people, 0.35% of the population of sampled systems (EPA SDWIS via Envirofacts).
Why the count needs raw data: states report copper 90th percentile values to EPA only when a system exceeds the copper action level, while lead 90th percentiles are reported for every system (40 CFR 142.15). All 7,412 copper records on Envirofacts are above 1.3 mg/L, against 283,784 lead records, so the denominator has to come from the lead records.
The typical exceedance is modest. The median of each exceeding system's highest copper 90th percentile was 1.75 mg/L, and 110 systems (17.7%) went above 2.6 mg/L, twice the action level. Exceedances also repeat: 291 of the 620 systems (46.9%) had exceeded in a period ending 2016 to 2022 as well.
Share of community water systems with a 90th percentile result whose copper value exceeded 1.3 mg/L, by monitoring period end year
Source: EPA SDWIS via Envirofacts, retrieved 2026-11-01. KBR calculation.
| Monitoring period end year | Systems with a 90th percentile result | Systems over copper action level | Share over (%) |
|---|---|---|---|
| 2016 | 15538 | 382 | 2.46 |
| 2017 | 14472 | 356 | 2.46 |
| 2018 | 14427 | 298 | 2.07 |
| 2019 | 16244 | 360 | 2.22 |
| 2020 | 14963 | 303 | 2.02 |
| 2021 | 14854 | 297 | 2.0 |
| 2022 | 17937 | 315 | 1.76 |
| 2023 | 17074 | 271 | 1.59 |
| 2024 | 16021 | 271 | 1.69 |
| 2025 | 19527 | 311 | 1.59 |
A system appears in each year it has a period ending that year. Periods ending 2016 are the earliest on Envirofacts; 2025 reports may still be arriving.
Source: [1][2][3] U.S. Environmental Protection Agency; U.S. Environmental Protection Agency; U.S. Environmental Protection Agency
Small groundwater systems account for most copper exceedances
Exceedance rates fall as systems get bigger, and groundwater systems exceed more often than surface water systems. This matches what corrosion research says about soft, low-alkalinity and untreated well water.
Share of sampled community water systems over 1.3 mg/L copper, by population served, periods ending 2023 to 2025
Source: EPA SDWIS via Envirofacts, retrieved 2026-11-01. KBR calculation.
| Group | Sampled systems | Systems over copper action level | Share over (%) | Population served by systems over |
|---|---|---|---|---|
| Source: Groundwater | 31392 | 516 | 1.64 | 871822 |
| Source: Surface water | 10173 | 104 | 1.02 | 218528 |
| Source: Not coded | 2 | 0 | 0.0 | 0 |
| Size: 500 or fewer | 21161 | 357 | 1.69 | 66899 |
| Size: 501 to 3,300 | 11298 | 191 | 1.69 | 239069 |
| Size: 3,301 to 10,000 | 4743 | 46 | 0.97 | 249936 |
| Size: 10,001 to 100,000 | 3902 | 26 | 0.67 | 534446 |
| Size: More than 100,000 | 463 | 0 | 0.0 | 0 |
Size bands follow the 3,300-person line the rule uses for monitoring waivers. Two sampled systems have no source code.
Source: [1][2][3][5] U.S. Environmental Protection Agency; U.S. Environmental Protection Agency; U.S. Environmental Protection Agency; Office of the Federal Register / eCFR
548 of the 620 exceeding systems (88.4%) serve 3,300 people or fewer. The median exceeding system serves 369 people, against 486 for all sampled systems. None of the 463 systems serving more than 100,000 people exceeded in 2023 to 2025, and the largest exceeder served 37,983.
Groundwater systems exceeded at 1.64% (516 of 31,392) and surface water systems at 1.02% (104 of 10,173), a ratio of 1.61. USGS classified 32% of 20,962 groundwater sites as potentially corrosive and found such water in every state and DC (USGS SIR 2016-5092). The same report notes 44 million people rely on their own wells or springs, which no utility samples; see the hard water map for utility hardness data.
| Water system (SDWIS name) | PWSID | State | Population served | Source water | Highest copper 90th percentile in window (mg/L) | Monitoring period |
|---|---|---|---|---|---|---|
| CARPENTERSVILLE | IL0890200 | IL | 37983 | Groundwater | 1.4 | 2022-01-01 to 2024-12-31 |
| Joint Powers Water Board | MN1860024 | MN | 30922 | Groundwater | 1.52 | 2023-01-01 to 2025-12-31 |
| ALGONQUIN | IL1110050 | IL | 30700 | Groundwater | 1.6 | 2022-01-01 to 2024-12-31 |
| STOUGHTON WATER DEPARTMENT | MA4285000 | MA | 29281 | Surface water | 1.37 | 2023-01-01 to 2023-12-31 |
| LAKE IN THE HILLS | IL1110400 | IL | 28661 | Groundwater | 2.1 | 2023-07-01 to 2023-12-31 |
| CITY OF LAKE JACKSON | TX0200006 | TX | 27314 | Surface water | 1.36 | 2025-01-01 to 2025-12-31 |
| WOODSTOCK | IL1110950 | IL | 25630 | Groundwater | 1.5 | 2021-01-01 to 2023-12-31 |
| PAW GLEN ALSACE DIV | PA3060088 | PA | 24951 | Surface water | 1.45 | 2025-06-01 to 2025-09-30 |
| HASTINGS, CITY OF | NE3100101 | NE | 24927 | Groundwater | 1.44 | 2023-01-01 to 2025-12-31 |
| JACKSON, TOWN OF | WY5600213 | WY | 24760 | Groundwater | 1.39 | 2023-01-01 to 2025-12-31 |
Names as recorded in SDWIS. An exceedance triggers required corrosion control steps; it is not by itself a finding that a utility broke the rule.
Source: [1][2][3] U.S. Environmental Protection Agency; U.S. Environmental Protection Agency; U.S. Environmental Protection Agency
Alaska, Minnesota, Nebraska and Illinois have the highest copper exceedance shares
State shares are only comparable where reporting is complete. In 13 jurisdictions fewer than 85% of active systems have any 90th percentile in the window, so their shares are shown in the table but left off the map.
Systems with a copper 90th percentile above 1.3 mg/L, periods ending 2023 to 2025, as a share of systems with a result. Blank tiles: reporting coverage under 85%.
Source: EPA SDWIS via Envirofacts (LCR_SAMPLE, LCR_SAMPLE_RESULT, WATER_SYSTEM), retrieved 2026-11-01. KBR calculation.
Among states with at least 85% reporting coverage, Alaska had the highest share of sampled systems over the copper action level (8.8%), then Minnesota (4.5%), Nebraska (3.9%) and Illinois (3.8%). Illinois had the most exceeding systems, 64, serving 291,857 people. By population, Wyoming stands out: 5.34% of the people served by its sampled systems were on a system over the action level.
Pennsylvania is the clearest coverage gap: only 394 of 1,849 active systems (21.3%) have a 90th percentile record for the window, so its 8.1% share is not comparable with other states.
Show all 51 rows
| State | Active community water systems | Systems with a lead or copper 90th percentile result, periods ending 2023 to 2025 | Reporting coverage (%) | Systems over the 1.3 mg/L copper action level | Share of sampled systems over (%) | Population served by systems over | Share of sampled population (%) | Flag |
|---|---|---|---|---|---|---|---|---|
| AK | 407 | 351 | 86.2 | 31 | 8.8 | 8970 | 1.32 | |
| AL | 501 | 473 | 94.4 | 4 | 0.8 | 17724 | 0.28 | |
| AR | 658 | 163 | 24.8 | 0 | 0.0 | 0 | 0.0 | low coverage |
| AZ | 746 | 717 | 96.1 | 0 | 0.0 | 0 | 0.0 | |
| CA | 2803 | 2522 | 90.0 | 36 | 1.4 | 18020 | 0.05 | |
| CO | 1058 | 971 | 91.8 | 18 | 1.9 | 10151 | 0.15 | |
| CT | 474 | 470 | 99.2 | 4 | 0.9 | 600 | 0.02 | |
| DC | 4 | 3 | 75.0 | 0 | 0.0 | 0 | 0.0 | low coverage |
| DE | 204 | 189 | 92.6 | 2 | 1.1 | 1005 | 0.1 | |
| FL | 1593 | 1523 | 95.6 | 17 | 1.1 | 21688 | 0.1 | |
| GA | 1743 | 1606 | 92.1 | 20 | 1.2 | 18695 | 0.2 | |
| HI | 118 | 21 | 17.8 | 0 | 0.0 | 0 | 0.0 | low coverage |
| IA | 1082 | 1058 | 97.8 | 7 | 0.7 | 1834 | 0.06 | |
| ID | 762 | 712 | 93.4 | 9 | 1.3 | 2315 | 0.15 | |
| IL | 1788 | 1690 | 94.5 | 64 | 3.8 | 291857 | 2.42 | |
| IN | 767 | 723 | 94.3 | 9 | 1.2 | 17009 | 0.33 | |
| KS | 853 | 817 | 95.8 | 19 | 2.3 | 46766 | 1.64 | |
| KY | 372 | 356 | 95.7 | 0 | 0.0 | 0 | 0.0 | |
| LA | 898 | 883 | 98.3 | 20 | 2.3 | 50411 | 0.96 | |
| MA | 528 | 508 | 96.2 | 10 | 2.0 | 41895 | 0.44 | |
| MD | 460 | 362 | 78.7 | 3 | 0.8 | 440 | 0.02 | low coverage |
| ME | 386 | 385 | 99.7 | 9 | 2.3 | 9805 | 1.42 | |
| MI | 1376 | 1088 | 79.1 | 14 | 1.3 | 20597 | 0.28 | low coverage |
| MN | 969 | 953 | 98.3 | 43 | 4.5 | 145030 | 3.1 | |
| MO | 1434 | 1369 | 95.5 | 2 | 0.1 | 806 | 0.01 | |
| MS | 1011 | 965 | 95.5 | 8 | 0.8 | 9143 | 0.29 | |
| MT | 804 | 590 | 73.4 | 4 | 0.7 | 3494 | 0.48 | low coverage |
| NC | 1978 | 1901 | 96.1 | 35 | 1.8 | 10340 | 0.11 | |
| ND | 305 | 303 | 99.3 | 9 | 3.0 | 4080 | 0.58 | |
| NE | 583 | 541 | 92.8 | 21 | 3.9 | 48689 | 2.93 | |
| NH | 706 | 58 | 8.2 | 2 | 3.4 | 1826 | 0.25 | low coverage |
| NJ | 555 | 553 | 99.6 | 12 | 2.2 | 38523 | 0.43 | |
| NM | 557 | 361 | 64.8 | 6 | 1.7 | 896 | 0.05 | low coverage |
| NV | 193 | 159 | 82.4 | 2 | 1.3 | 730 | 0.02 | low coverage |
| NY | 2246 | 1868 | 83.2 | 40 | 2.1 | 33233 | 0.19 | low coverage |
| OH | 1122 | 1117 | 99.6 | 6 | 0.5 | 11692 | 0.11 | |
| OK | 890 | 816 | 91.7 | 16 | 2.0 | 22775 | 0.64 | |
| OR | 939 | 824 | 87.8 | 8 | 1.0 | 10872 | 0.29 | |
| PA | 1849 | 394 | 21.3 | 32 | 8.1 | 51614 | 0.49 | low coverage |
| RI | 88 | 72 | 81.8 | 5 | 6.9 | 1379 | 0.13 | low coverage |
| SC | 559 | 533 | 95.3 | 14 | 2.6 | 4780 | 0.1 | |
| SD | 463 | 454 | 98.1 | 2 | 0.4 | 3212 | 0.37 | |
| TN | 445 | 445 | 100.0 | 2 | 0.4 | 6836 | 0.09 | |
| TX | 4757 | 4428 | 93.1 | 21 | 0.5 | 56232 | 0.17 | |
| UT | 502 | 450 | 89.6 | 2 | 0.4 | 4629 | 0.13 | |
| VA | 1056 | 994 | 94.1 | 5 | 0.5 | 3452 | 0.05 | |
| VT | 404 | 390 | 96.5 | 6 | 1.5 | 2793 | 0.64 | |
| WA | 2309 | 2076 | 89.9 | 7 | 0.3 | 712 | 0.01 | |
| WI | 1022 | 667 | 65.3 | 5 | 0.7 | 4240 | 0.11 | low coverage |
| WV | 413 | 377 | 91.3 | 1 | 0.3 | 48 | 0.0 | |
| WY | 323 | 318 | 98.5 | 8 | 2.5 | 28512 | 5.34 |
Low coverage: fewer than 85% of active systems have any 90th percentile result in SDWIS for the window, so the share is not comparable. Population is the SDWIS population served at download.
Source: [1][2][3] U.S. Environmental Protection Agency; U.S. Environmental Protection Agency; U.S. Environmental Protection Agency
What eats a pinhole through copper: pH, chlorine, oxygen and flow
A Maryland state task force, EPA guidance and Virginia Tech pipe-loop studies point to water chemistry and flow, not defective tube, as the main drivers of pinhole leaks.
| Factor | What the research found | Setting | Source |
|---|---|---|---|
| pH 7 to 7.8 in hard or moderately hard water | Type I pitting: deep, narrow pits that end in pipe failure, mostly in cold water | Literature summarized by a state task force | Maryland task force (2004), citing Ferguson et al. (1996) |
| pH below 7.2 in certain soft waters | Type II pitting, rare below 140 F | Literature summarized by a state task force | Maryland task force (2004) |
| pH above 8.0 in cold soft water | Type III pitting: wide, shallow pits, blue water or blockage | Literature summarized by a state task force | Maryland task force (2004) |
| Aluminum solids plus free chlorine at high pH | First laboratory reproduction of field-type pinholes; one 1-foot length of Type M pipe produced 8 pinholes | Virginia Tech pipe tests with water modelled on WSSC supply | Marshall (2004); Maryland task force (2004) |
| Free chlorine residual | Pits started faster with more chlorine; even about 0.4 mg/L eventually caused severe pitting | Laboratory, aggressive potable water | Sarver and Edwards (2012) |
| Dissolved oxygen | More dissolved oxygen can increase copper corrosion; well-aerated water carries about 8 to 9 mg/L | Utility guidance | EPA OCCT technical recommendations (2016) |
| Alkalinity | Higher alkalinity slowed pit growth but did not stop pits from starting | Pipe-loop tests | Sarver (2010) |
| Flow velocity | At 11.2 feet per second a pinhole formed in quarter-inch tube after 2 months | Laboratory | Custalow (2009) |
| Phosphate and silica inhibitors | 1 mg/L phosphate (as P) prevented pits from starting; 5 mg/L silica (as Si) slowed pitting; under-dosing can speed attack | Laboratory | Sarver and Edwards (2012) |
| Microbes fed by organic matter | Can cause microbially induced copper corrosion (pinhole leaks) | Utility guidance | EPA OCCT technical recommendations (2016) |
| Pipe age | Copper release into water is typically higher in newer copper plumbing | Utility guidance | EPA OCCT technical recommendations (2016) |
Laboratory results show mechanisms under test conditions; they do not predict how long a given home's pipes will last.
Source: [13][14][17][11][16][15] State of Maryland, Department of Housing and Community Development; Virginia Tech (VTechWorks); Virginia Tech (VTechWorks) / Hindawi; U.S. Environmental Protection Agency; Virginia Tech (VTechWorks); Virginia Tech (VTechWorks)
Maryland's 2004 task force concluded that pitting and pinhole leaks there were not caused by deficiencies in the manufacture of copper plumbing, and, apart from excess flux, not by installation (Maryland task force). It recommended that utilities minimize aluminum and keep pH below the EPA recommended maximum of 8.5.
In the WSSC service area about 5,400 of roughly 417,000 accounts (1.3%) had reported pinhole leaks by June 2004, mostly in cold-water horizontal pipe, and nearly 80% of reports involved homes built before 1970. Virginia Tech then reproduced field-type pinholes in the laboratory for the first time using water with aluminum, high chlorine and relatively high pH (Marshall, 2004).
Dissolved oxygen is part of the picture. EPA's corrosion control guidance says increasing dissolved oxygen can increase copper corrosion, and that well-aerated water carries about 8 to 9 mg/L; it also says copper release depends on pH, dissolved inorganic carbon and redox potential, and is typically higher in newer copper plumbing (EPA, 2016). Hard water is a separate issue covered in the hard water map.
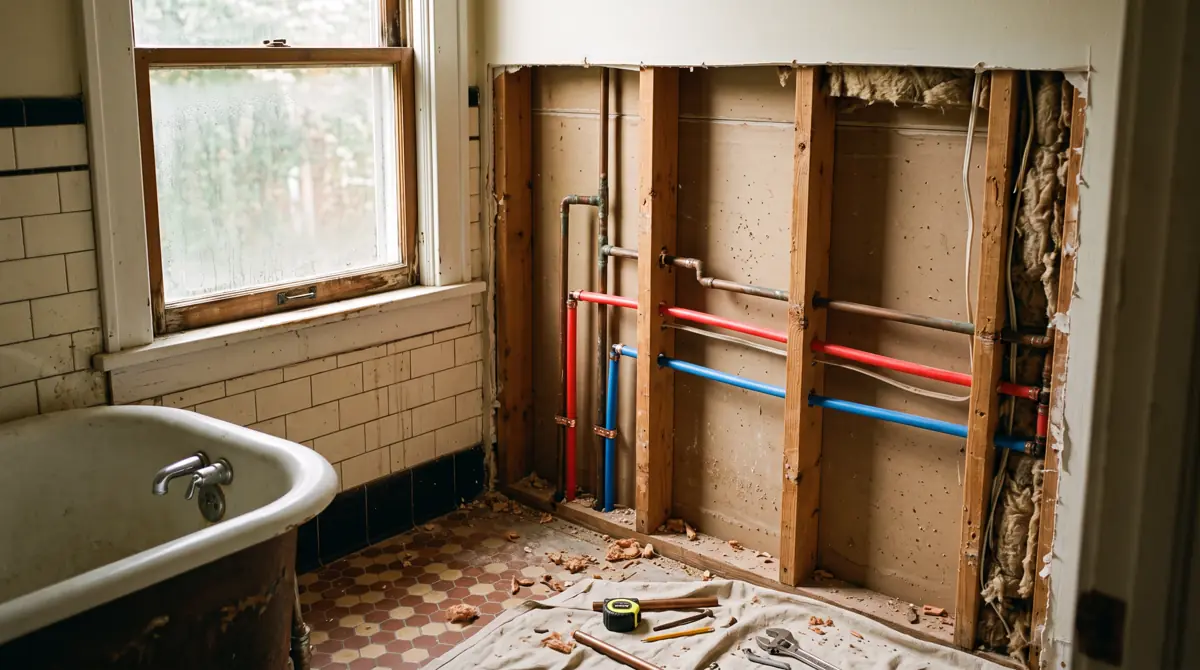
What the November 1, 2027 rule date changes for copper, and what it does not
The Lead and Copper Rule Improvements change lead requirements far more than copper. The copper action level remains 1.3 mg/L.
- Copper action level: exceeded when the 90th percentile is greater than 1.3 mg/L, unchanged in the current rule text (40 CFR 141.80).
- Lead action level: 0.010 mg/L in the current text, down from the 15 ppb (0.015 mg/L) EPA describes for the earlier rule.
- Compliance date: community water systems must comply with the revised rule no later than November 1, 2027; the LCRI took effect December 30, 2024 (89 FR 86418).
- Lead pipes: the LCRI requires systems to identify and replace lead pipes within 10 years; state counts are in the lead pipes map.
- Monitoring: systems with two consecutive periods at or below 0.65 mg/L copper (and 0.005 mg/L lead) can move to triennial sampling, and systems serving 3,300 or fewer people can apply to sample once every 9 years (40 CFR 141.86).
- Solder: lead free means no more than 0.2 percent lead in solder and flux and a weighted average of 0.25 percent on wetted surfaces of pipes and fittings (40 CFR 143.12).
Reading your utility's copper record before opening a kitchen or bath wall
A remodel is often the one time supply pipes are exposed. The data here can frame questions for a plumber; it cannot say how long a particular home's pipes have left.
Each utility's lead and copper results are summarized in its annual Consumer Confidence Report, and the SDWIS records used here can be searched by water system. A system with repeat copper exceedances, as 46.9% of current exceeders have, is a different setting from one that qualifies for reduced monitoring at 0.65 mg/L or below.
If a wall is coming open anyway, the pipe decision sits inside the larger project budget and schedule; see bathroom remodel cost, kitchen remodel timeline and the contractor directory. Pipe and fitting price trends are tracked in building material prices, and leak damage in water damage statistics.
Key findings
- Fannie Mae's Appendix F tables (Form 4099.F, 10/14) give hot and cold water distribution an estimated useful life of 50 years and domestic hot water supply and return 30 years, without naming a pipe material.[19]
- The same 50-year and 30-year values appear in the Fannie Mae tables developed in 1991 that HUD attached to its Mark-to-Market inspection work, so the figure has stood for 35 years.[18][20]
- The NAHB and Bank of America Home Equity study (February 2007) lists cast iron and concrete waste pipe at 100 years and underground PVC piping at 25 years, but no copper supply pipe.[21]
- ASTM F876 requires PEX for drinking water to show a minimum extrapolated lifetime of 50 years in a hot chlorinated water test at 140 F and 80 psi, according to a 2006 design guide prepared for PPI, PPFA and HUD's PATH program.[22]
- 620 US community water systems had a copper 90th percentile above 1.3 mg/L in at least one tap sampling period ending 2023 to 2025, out of 41,567 active systems with results (1.49%).[1][2][3]
- Those 620 systems serve 1,090,350 people, 0.35% of the 311,520,941 people served by sampled systems (SDWIS population at November 2026).[1][3]
- Systems serving 500 or fewer people exceeded at 1.69% in 2023 to 2025, against 0.67% for systems serving 10,001 to 100,000 people.[1][3]
- The largest exceeding system in 2023 to 2025 served 37,983 people (Carpentersville, Illinois, copper 90th percentile 1.4 mg/L).[1][3]
- Among states where at least 85% of systems reported, Alaska had the highest exceedance share at 8.8%, followed by Minnesota at 4.5%, Nebraska at 3.9% and Illinois at 3.8%, for periods ending 2023 to 2025.[1][2]
- Illinois had the most exceeding systems, 64, serving 291,857 people, for periods ending 2023 to 2025.[1][3]
- The yearly exceedance share fell from 2.46% for periods ending 2016 to 1.59% for periods ending 2025, a drop of 0.87 percentage points.[1][2]
- Through June 2004, about 5,400 of roughly 417,000 WSSC accounts in Montgomery and Prince George's counties, Maryland reported pinhole leaks, and nearly 80% of reports involved homes built before 1970.[13]
- USGS classified 32% of 20,962 US groundwater sites as potentially corrosive and found potentially corrosive groundwater in all 50 states and DC (2016).[12]
- Sarver and Edwards (2012) found that about 0.4 mg/L free chlorine eventually caused severe copper pitting, and that 1 mg/L phosphate prevented pits from starting.[17]
Summary for decision makers
- The 50-year life that Fannie Mae assigns to hot and cold water distribution is the most traceable figure behind copper pipe lifespan claims, and it applies to any material.
- The 2007 NAHB life expectancy study, often cited for home component lifespans, has 0 entries for copper, PEX, CPVC or galvanized supply pipe; its copper 50+ entry is for gutters.
- In tap sampling periods ending 2023 to 2025, 620 community water systems (1.49% of 41,567 with results) had a copper 90th percentile above 1.3 mg/L, serving 1,090,350 people.
- Small systems dominate: 88.4% of exceeders serve 3,300 people or fewer, and 0 of 463 systems serving more than 100,000 exceeded.
- Groundwater systems exceeded at 1.64% against 1.02% for surface water systems, a ratio of 1.61, in line with USGS finding 32% of groundwater sites potentially corrosive.
- Exceedances are sticky: 46.9% of the 2023 to 2025 exceeders had also exceeded in a period ending 2016 to 2022.
- Pinhole leaks follow chemistry: state, EPA and Virginia Tech research tie them to pH, free chlorine, low alkalinity, aluminum, oxygen and fast flow, not to manufacturing defects.
Questions people ask
How long does PEX last?
PEX pipe for drinking water must show a minimum extrapolated lifetime of 50 years in the ASTM F2023 hot chlorinated water test (ASTM F876), run at 140 F and 80 psi. That is a laboratory pass mark. PEX was first introduced in North America in 1984, 42 years ago, so no field record yet reaches 50 years.
How long do galvanized pipes last?
No Tier 1 or Tier 2 source opened for this report gives a galvanized-specific figure. Popular pages range from 20 to 50 years for water mains to up to 100 years. The Maryland task force notes the zinc layer corrodes first, then the steel. Fannie Mae's 50-year figure for water distribution applies to any material.
What causes pinhole leaks in copper pipes?
The sources point to water chemistry and flow: pH above 8.0 in soft water, free chlorine residuals as low as about 0.4 mg/L over time, low alkalinity, aluminum solids, dissolved oxygen and high velocity. Maryland's task force found pinhole leaks there were not caused by defective tube.
When should you repipe a house?
No dataset sets an age. Signals in the sources include repeated pinhole leaks, a utility with repeat copper exceedances, and pipes near the 50-year planning life Fannie Mae uses. Maryland's 2004 report cited $3,000 to $5,000 for epoxy lining a small house as one alternative. A licensed plumber should assess a specific home.
Is PEX better than copper?
The sources do not settle it. PEX does not pit, according to its 2006 design guide, which was prepared for plastic pipe trade groups, but PEX is sensitive to hot chlorinated water and sunlight. Copper's risk is pitting in aggressive water. Maryland notes plastic is often used where water pH is 6.5 or lower.
For journalists and researchers
If you cite only a few, cite these
- 620 community water systems (1.49% of those sampled) exceeded the copper action level in periods ending 2023 to 2025, serving 1,090,350 people.[1][3]
- 88.4% of exceeders serve 3,300 people or fewer.[1][3]
- Fannie Mae's 50-year useful life for water distribution is material-neutral; NAHB's 2007 study has no copper supply pipe entry.[19][21]
Most quotable statistics
- 620 US community water systems exceeded the 1.3 mg/L copper action level in tap sampling periods ending 2023 to 2025, 1.49% of the 41,567 with results.[1][2]
- 88.4% of community water systems over the copper action level in 2023 to 2025 served 3,300 people or fewer.[1][3]
- None of the 463 US water systems serving more than 100,000 people exceeded the copper action level in periods ending 2023 to 2025.[1][3]
- Groundwater systems exceeded the copper action level 1.61 times as often as surface water systems in 2023 to 2025.[1][3]
- The 50-year life commonly attached to copper pipe matches Fannie Mae's useful life for hot and cold water distribution of any material, a value present in tables developed in 1991.[19][18]
- 46.9% of water systems over the copper action level in 2023 to 2025 had also exceeded in 2016 to 2022.[1]
Press summary
A new Kitchen and Bath Renovators analysis of EPA Safe Drinking Water Information System records finds that 620 US community water systems, 1.49% of the 41,567 with results, delivered tap water over the 1.3 mg/L copper action level in sampling periods ending 2023 to 2025. Those systems serve 1,090,350 people. The problem is concentrated in small utilities: 88.4% of exceeders serve 3,300 people or fewer, and none of the 463 systems serving more than 100,000 people exceeded. Groundwater systems exceeded 1.61 times as often as surface water systems, and 46.9% of exceeders had also exceeded in 2016 to 2022. The report also traces the common claim that copper pipes last 50 years to Fannie Mae's useful life for water distribution of any material, a value present in tables developed in 1991, and finds the widely cited 2007 NAHB lifespan study has no entry for copper supply pipe. Alaska, Minnesota, Nebraska and Illinois had the highest exceedance shares among states with complete reporting.
Suggested headlines
- 620 US water systems topped EPA's copper action level in 2023 to 2025
- Copper pipe's 50-year lifespan comes from a budgeting table, not a copper study
- Nearly 9 in 10 copper exceedances are at utilities serving 3,300 people or fewer
- Groundwater systems exceed EPA's copper trigger 1.61 times as often as surface water systems
- No large US utility exceeded the copper action level in 2023 to 2025
How to cite this report
Kitchen and Bath Renovators. (2026). How Long Do Copper Pipes Last? Pipe Lifespans by Material and Water. Retrieved from https://kitchenandbathrenovators.com/research/how-long-do-copper-pipes-last/
Reuse license
Data and tables are licensed CC BY 4.0. Attribution: “Source: Kitchen and Bath Renovators, How Long Do Copper Pipes Last? Pipe Lifespans by Material and Water” with a link to this page.
Download the data
Every table in this report is available as a CSV under CC BY 4.0. The fact sheet lists each value with its source URL and access date.
Frequently asked questions
What is the copper action level?
Under 40 CFR 141.80 a system exceeds the copper action level when the 90th percentile of its tap samples is greater than 1.3 mg/L. The 90th percentile is the sample at rank number of samples times 0.9.
Is a copper action level exceedance a violation?
No. The Lead and Copper Rule is a treatment technique rule, and an exceedance triggers required steps such as corrosion control. EPA says a system over 1.3 ppm in more than 10% of taps must take additional actions.
How many people get water from systems over the copper action level?
1,090,350 people were served by the 620 community water systems that exceeded in periods ending 2023 to 2025, 0.35% of the population of sampled systems.
Which states have the most copper exceedances?
Illinois had the most exceeding systems, 64, in periods ending 2023 to 2025. By share of sampled systems, Alaska led at 8.8%, among states with at least 85% reporting coverage.
Do large city water systems exceed the copper action level?
None of the 463 community water systems serving more than 100,000 people exceeded in periods ending 2023 to 2025. The largest exceeder served 37,983 people.
Does well water corrode copper pipes faster?
Groundwater-sourced systems exceeded the copper action level at 1.64% against 1.02% for surface water systems in 2023 to 2025. USGS rated 32% of groundwater sites potentially corrosive; private wells serving 44 million people are not in this data.
Does new copper pipe release more copper?
Yes, typically. EPA's 2016 corrosion control guidance says copper release is typically higher in newer copper plumbing and depends on pH, dissolved inorganic carbon and redox potential.
Did the 2024 Lead and Copper Rule Improvements change the copper limit?
No. The current rule text keeps the copper action level at 1.3 mg/L while setting the lead action level at 0.010 mg/L. Systems must comply by November 1, 2027.
How long do cast iron drain pipes last?
The 2007 NAHB study lists cast iron waste pipe at 100 years, with inputs that include the Cast Iron Soil Pipe Institute. Fannie Mae lists sanitary waste and vent systems at 50+ years.
Can copper pipes be joined with lead solder?
Not for drinking water. Lead free solder and flux may contain no more than 0.2 percent lead under 40 CFR 143.12.
Reproduce this analysis
Every figure comes from the files below. The scripts that pulled and computed them are kept with the report and can be re-run.
| Dataset | Publisher | Source | Query or filter | Rows used | Retrieved |
|---|---|---|---|---|---|
| SDWIS LCR_SAMPLE_RESULT | U.S. EPA (Envirofacts) | File or endpoint | Full table paged in 10,000-row blocks (ROWS/start:end/CSV); CONTAMINANT_CODE PB90 and CU90 | 291,196 rows; 1,036 CU90 rows above 1.3 mg/L in the window for states and DC after screening | 2026-11-01 |
| SDWIS LCR_SAMPLE | U.S. EPA (Envirofacts) | File or endpoint | Full table; SAMPLING_END_DATE year 2023 to 2025 for the window, 2016 to 2022 for history | 290,722 rows, all matched to results on PWSID plus SAMPLE_ID | 2026-11-01 |
| SDWIS WATER_SYSTEM (community water systems) | U.S. EPA (Envirofacts) | File or endpoint | PWS_TYPE_CODE = CWS; PWS_ACTIVITY_CODE = A; PWSID prefix in the 50 states and DC; primacy type not Tribal | 97,156 rows; 48,063 active systems kept | 2026-11-01 |
| Instructions for Performing a Multifamily PCA, Appendix F EUL tables (Form 4099.F, 10/14) | Fannie Mae (Internet Archive capture of official PDF) | File or endpoint | Water distribution and domestic hot water table; sanitary waste and vent table | 3 rows used | 2026-11-01 |
| Study of Life Expectancy of Home Components | NAHB and Bank of America Home Equity (Internet Archive capture) | File or endpoint | All 25 tables searched for pipe, plumbing, copper, PEX, CPVC, PVC, galvanized and cast iron | 4 rows used (cast iron and concrete waste pipe, underground PVC piping, copper gutters) | 2026-11-01 |
Data quality and exclusions
- Joined results to periods on PWSID plus SAMPLE_ID because SAMPLE_ID alone repeats across systems (1,090 sample IDs map to more than one system); 0 results were left unmatched.
- Dropped 3 copper 90th percentile records in the window above 10 mg/L (lowest 11.0 mg/L) as probable unit errors; none of the 3 systems had another exceedance, so the count fell from 623 to 620.
- Excluded 12,079 sampling records with periods ending in 2026, an incomplete year, and records with scheduled end dates after 2026.
- Kept 48,063 of 49,342 active community water systems; 1,279 tribal, territorial or non-state systems were excluded from state rows and national totals.
- 6,496 active systems had no 90th percentile result in the window and are outside the denominator; 13 jurisdictions with coverage under 85% are left off the map but kept in totals.
- Confirmed exceedance-only copper reporting: all 7,412 CU90 records on Envirofacts are above 1.3 mg/L, and a count query for values at or below 1.3 returned 0.
Methodology
Source selection: service-life figures were taken only from documents that state them directly (Fannie Mae, a HUD-hosted copy of Fannie Mae tables, NAHB, a PEX design guide prepared for PPI, PPFA and HUD PATH). InterNACHI and ASHI were allowed only as Tier 3; InterNACHI blocked automated access and its archived copy did not contain the table, so it is not used. Three popular pages are shown only to compare their unsourced ranges. Pages that blocked automated access (Fannie Mae, HUD User, WSSC) were read from labelled Internet Archive captures of the official files.
Copper exceedances: KBR downloaded the full Envirofacts SDWIS tables LCR_SAMPLE (290,722 rows), LCR_SAMPLE_RESULT (291,196 rows) and WATER_SYSTEM for community water systems (97,156 rows) on 2026-11-01 without an API key, joined results to sampling periods on PWSID plus SAMPLE_ID, and kept periods whose end date falls in 2023, 2024 or 2025, the latest three complete calendar years. Three years covers systems on standard, annual and triennial monitoring.
Because states report copper 90th percentiles only for exceedances (40 CFR 142.15), the denominator is every active community water system with any lead or copper 90th percentile in the window. A system counts as over if any copper 90th percentile in the window exceeds 1.3 mg/L. Population is the SDWIS population served at download.
Conflicts: where popular pages and sourced tables disagree, the sourced figure is shown and the popular range is labelled as unsourced. Where no sourced figure exists (CPVC, galvanized), the index says not available rather than choosing a range.
Derived metrics are listed in derived_metrics.csv with formulas and input rows and can be rebuilt with scripts/fetch_envirofacts.py, scripts/compute_lcr.py, scripts/build_facts.py and scripts/build_report.py.
Limitations: SDWIS completeness varies by state; 13 jurisdictions have under 85% coverage. A system 90th percentile does not describe any single home. Service-life figures are planning values or lab extrapolations, not measured failure ages. Last updated 2026-11-01.
This report presents published data with its limitations. It is not legal, financial or investment advice.
Sources, ranked by quality
Tier 1: primary and official sources (18)
- [1] U.S. Environmental Protection Agency. EPA Envirofacts SDWIS table LCR_SAMPLE_RESULT (90th percentile lead and copper results). Tap sampling periods ending 2016 to 2033 (scheduled); used 2016 to 2025. Accessed 2026-11-01.
- [2] U.S. Environmental Protection Agency. EPA Envirofacts SDWIS table LCR_SAMPLE (tap sampling periods). Same as results table. Accessed 2026-11-01.
- [3] U.S. Environmental Protection Agency. EPA Envirofacts SDWIS table WATER_SYSTEM, community water systems. System inventory at 2026-11-01. Accessed 2026-11-01.
- [4] Office of the Federal Register / eCFR. 40 CFR 141.80, General requirements (Lead and Copper Rule, current eCFR text). Current text, accessed 2026-11-01. Accessed 2026-11-01.
- [5] Office of the Federal Register / eCFR. 40 CFR 141.86, Monitoring requirements for lead and copper in tap water (current eCFR text). Current text, accessed 2026-11-01. Accessed 2026-11-01.
- [6] Office of the Federal Register / eCFR. 40 CFR 142.15, Reports by States (current eCFR text). Current text, accessed 2026-11-01. Accessed 2026-11-01.
- [7] Office of the Federal Register / eCFR. 40 CFR 143.12, Definition of lead free (current eCFR text). Current text, accessed 2026-11-01. Accessed 2026-11-01.
- [8] U.S. Environmental Protection Agency. Lead and Copper Rule (program page, last updated January 2, 2026). Page updated 2026-01-02. Accessed 2026-11-01.
- [9] U.S. Environmental Protection Agency. Lead and Copper Rule Improvements (program page, last updated December 29, 2025). Page updated 2025-12-29. Accessed 2026-11-01.
- [10] Federal Register (EPA). National Primary Drinking Water Regulations for Lead and Copper: Improvements (LCRI), 89 FR 86418, document metadata. Published 2024-10-30. Accessed 2026-11-01.
- [11] U.S. Environmental Protection Agency. Optimal Corrosion Control Treatment Evaluation Technical Recommendations, EPA 816-B-16-003 (March 2016, updated). March 2016 (updated). Accessed 2026-11-01.
- [12] U.S. Geological Survey. Potential Corrosivity of Untreated Groundwater in the United States, SIR 2016-5092 (Belitz, Jurgens and Johnson). 2016. Accessed 2026-11-01.
- [13] State of Maryland, Department of Housing and Community Development. Final Report: Task Force to Study Pinhole Leaks in Copper Plumbing (December 2004), Internet Archive capture of the WSSC-hosted PDF. December 2004. Accessed 2026-11-01.
- [14] Virginia Tech (VTechWorks). Initiation, Propagation, and Mitigation of Aluminum and Chlorine Induced Pitting Corrosion (B. J. Marshall, thesis, 2004). 2004. Accessed 2026-11-01.
- [15] Virginia Tech (VTechWorks). Influences of Water Chemistry and Flow Conditions on Non-Uniform Corrosion in Copper Tube (B. D. Custalow, MS thesis, 2009). 2009. Accessed 2026-11-01.
- [16] Virginia Tech (VTechWorks). Insights Into Non-Uniform Copper and Brass Corrosion in Potable Water Systems (E. A. Sarver, dissertation, 2010). 2010. Accessed 2026-11-01.
- [17] Virginia Tech (VTechWorks) / Hindawi. Inhibition of Copper Pitting Corrosion in Aggressive Potable Waters (Sarver and Edwards, International Journal of Corrosion, 2012). 2012. Accessed 2026-11-01.
- [18] U.S. Department of Housing and Urban Development (hosting Fannie Mae tables). Fannie Mae Physical Needs Assessment Guidance, Attachment A to HUD Mark-to-Market inspection statement of work (EUL tables developed 1991), Internet Archive capture. Tables developed 1991. Accessed 2026-11-01.
Tier 2: trade bodies, market research, company data (4)
- [19] Fannie Mae. Instructions for Performing a Multifamily Property Condition Assessment, Appendix F Estimated Useful Life Tables, Form 4099.F (10/14), Internet Archive capture. Form 4099.F 10/14. Accessed 2026-11-01.
- [20] Fannie Mae. Instructions for Performing a Multifamily Property Condition Assessment, Form 4099 (January 2026), Internet Archive capture. January 2026. Accessed 2026-11-01.
- [21] National Association of Home Builders / Bank of America Home Equity. Study of Life Expectancy of Home Components (February 2007), Internet Archive capture. February 2007. Accessed 2026-11-01.
- [22] NAHB Research Center for PPI, PPFA and HUD's PATH program. Design Guide: Residential PEX Water Supply Plumbing Systems (November 2006), Internet Archive capture of the HUD User PDF. November 2006. Accessed 2026-11-01.
Tier 3: journalism and expert commentary (3)
- [23] BobVila.com. PEX vs. Copper: Which Pipes Are Best for Your Plumbing Project?. Undated, accessed 2026-11-01. Accessed 2026-11-01.
- [24] This Old House. Types of Plumbing Pipes. Undated, accessed 2026-11-01. Accessed 2026-11-01.
- [25] Balkan Sewer and Water Main Service. The Answer To How Long Do Copper Water Lines Last. Undated, accessed 2026-11-01. Accessed 2026-11-01.