Polybutylene Pipe: Where It Was Installed and How Much Housing Dates From the PB Years
- Primary data
- Census Building Permits Survey state annual files 1980 to 1999; ACS 2025 1-year B25001 and B25034
- Data period
- 1980 to 1995 permits; 2025 housing stock
- Latest release used
- 2026-10-29
- Next release
- ACS 2026 1-year, expected autumn 2027
- Geography
- 50 states and DC
- Sources
- 23 (16 Tier 1)
Polybutylene pipe, a gray flexible plastic supply line that HUD accepted in April 1978, went into US homes until the Cox class window closed on July 31, 1995. Census permits record 21.35 million housing units authorized in 1980 to 1995, equal to 14.4 percent of the 2025 housing stock; Nevada (22.8 percent) and Florida (22.4 percent) rank highest.
Polybutylene pipe years: Nevada and Florida permitted the most homes relative to today's stock
Building permits were issued for 21,352,930 US housing units in 1980 to 1995, equal to 14.4 percent of the 148,228,967 housing units the ACS counted in 2025. Nevada (22.8 percent) and Florida (22.4 percent) lead; the District of Columbia (2.6 percent) and West Virginia (4.2 percent) trail.
Housing units authorized by building permits 1980 to 1995 divided by ACS 2025 housing units, percent
Source: U.S. Census Bureau, Building Permits Survey state annual files 1980 to 1995; ACS 2025 1-year B25001. KBR analysis.
Nevada issued permits for 316,438 units in 1980 to 1995 against a 2025 stock of 1,385,027 units, which puts it first on the ratio even though it ranks only 24th by raw count. Florida issued permits for 2,420,864 units against 10,788,709, a ratio of 22.4 percent, and is the only state in the top two on both measures (Census BPS, ACS 2025 B25001).
Texas is the counterweight. Texas issued permits for 1,756,830 units in the PB years, third in the country, but Texas kept building after 1995, so PB-era permits equal only 13.7 percent of its 2025 stock, below the national 14.4 percent. In all, 19 jurisdictions sit at or above the national ratio.
PB-era permits: Privately owned housing units authorized by building permits in 1980 to 1995 in the Census Building Permits Survey state annual files (estimates with imputation, all structure types). The Cox settlement class covered PB installed from January 1, 1978 to July 31, 1995; the state annual series starts in 1980.
Show all 52 rows
| Rank by share | State | Units authorized 1980 to 1995 | Single-family share (%) | ACS 2025 housing units | PB-era permits as % of 2025 stock | Rank by count | Units authorized 1980 to 1999 | ACS 2025 homes built 1980 to 1999 | Survivors per 100 permits |
|---|---|---|---|---|---|---|---|---|---|
| 1 | Nevada | 316,438 | 61.9 | 1,385,027 | 22.8 | 24 | 458,133 | 476,564 | 104.0 |
| 2 | Florida | 2,420,864 | 60.8 | 10,788,709 | 22.4 | 2 | 2,993,199 | 3,388,757 | 113.2 |
| 3 | Virginia | 789,416 | 76.9 | 3,779,307 | 20.9 | 6 | 984,213 | 1,076,179 | 109.3 |
| 4 | Arizona | 701,690 | 63.6 | 3,373,271 | 20.8 | 7 | 942,206 | 1,076,154 | 114.2 |
| 5 | Hawaii | 118,140 | 59.3 | 574,519 | 20.6 | 38 | 133,278 | 156,848 | 117.7 |
| 6 | Maryland | 517,077 | 81.0 | 2,613,898 | 19.8 | 14 | 628,771 | 702,232 | 111.7 |
| 7 | New Hampshire | 127,139 | 72.0 | 662,142 | 19.2 | 35 | 149,566 | 189,005 | 126.4 |
| 8 | Georgia | 881,828 | 72.5 | 4,733,611 | 18.6 | 4 | 1,206,807 | 1,471,859 | 122.0 |
| 9 | California | 2,691,212 | 59.5 | 14,994,887 | 17.9 | 1 | 3,154,935 | 3,658,355 | 116.0 |
| 10 | Washington | 580,816 | 61.0 | 3,436,809 | 16.9 | 12 | 749,981 | 876,369 | 116.9 |
| 11 | Colorado | 447,911 | 69.1 | 2,692,470 | 16.6 | 16 | 632,568 | 699,827 | 110.6 |
| 12 | North Carolina | 811,039 | 72.9 | 5,167,865 | 15.7 | 5 | 1,116,319 | 1,463,642 | 131.1 |
| 13 | Minnesota | 406,918 | 70.7 | 2,614,529 | 15.6 | 18 | 522,645 | 605,707 | 115.9 |
| 14 | Delaware | 75,088 | 79.6 | 483,497 | 15.5 | 42 | 94,762 | 114,907 | 121.3 |
| 15 | New Mexico | 148,827 | 73.8 | 981,598 | 15.2 | 33 | 189,300 | 298,473 | 157.7 |
| 16 | Utah | 197,212 | 72.0 | 1,307,030 | 15.1 | 31 | 281,273 | 311,463 | 110.7 |
| 17 | Alaska | 49,032 | 58.7 | 330,538 | 14.8 | 45 | 59,317 | 117,535 | 198.1 |
| 18 | South Carolina | 382,188 | 71.6 | 2,579,738 | 14.8 | 20 | 511,400 | 739,138 | 144.5 |
| 19 | Vermont | 49,749 | 75.9 | 346,275 | 14.4 | 44 | 58,448 | 91,212 | 156.1 |
| 20 | Connecticut | 223,323 | 72.3 | 1,558,234 | 14.3 | 28 | 263,671 | 310,574 | 117.8 |
| 21 | Texas | 1,756,830 | 55.7 | 12,847,964 | 13.7 | 3 | 2,304,920 | 3,172,945 | 137.7 |
| 22 | Kansas | 177,656 | 64.7 | 1,318,100 | 13.5 | 32 | 236,925 | 299,404 | 126.4 |
| 23 | Wisconsin | 379,003 | 62.4 | 2,838,967 | 13.4 | 21 | 515,230 | 602,178 | 116.9 |
| 24 | Oregon | 254,533 | 65.6 | 1,909,202 | 13.3 | 25 | 358,449 | 460,304 | 128.4 |
| 25 | New Jersey | 502,600 | 73.8 | 3,827,544 | 13.1 | 15 | 618,112 | 752,242 | 121.7 |
| 26 | Indiana | 392,555 | 70.7 | 3,052,617 | 12.9 | 19 | 547,193 | 689,230 | 126.0 |
| 27 | Tennessee | 420,360 | 67.9 | 3,291,174 | 12.8 | 17 | 566,096 | 867,988 | 153.3 |
| 28 | Rhode Island | 61,896 | 70.6 | 489,071 | 12.7 | 43 | 73,086 | 89,117 | 121.9 |
| 29 | Michigan | 576,259 | 70.6 | 4,692,331 | 12.3 | 13 | 786,582 | 987,806 | 125.6 |
| 30 | Massachusetts | 372,679 | 71.4 | 3,072,185 | 12.1 | 22 | 445,347 | 562,947 | 126.4 |
| 31 | Missouri | 333,358 | 67.4 | 2,876,147 | 11.6 | 23 | 437,309 | 685,449 | 156.7 |
| 32 | Oklahoma | 208,099 | 64.8 | 1,816,238 | 11.5 | 29 | 258,511 | 426,131 | 164.8 |
| 33 | Maine | 88,088 | 78.8 | 771,487 | 11.4 | 41 | 109,447 | 195,308 | 178.4 |
| 34 | Idaho | 96,305 | 77.8 | 849,162 | 11.3 | 40 | 141,245 | 186,089 | 131.7 |
| 35 | Illinois | 606,132 | 67.5 | 5,503,532 | 11.0 | 10 | 804,005 | 1,069,286 | 133.0 |
| 36 | Louisiana | 237,659 | 67.7 | 2,156,514 | 11.0 | 26 | 305,120 | 544,525 | 178.5 |
| 37 | Ohio | 587,935 | 65.2 | 5,367,633 | 11.0 | 11 | 787,616 | 1,036,638 | 131.6 |
| 38 | Nebraska | 96,754 | 67.0 | 890,794 | 10.9 | 39 | 134,981 | 169,787 | 125.8 |
| 39 | North Dakota | 41,604 | 46.9 | 384,247 | 10.8 | 47 | 52,701 | 76,339 | 144.9 |
| 40 | Pennsylvania | 627,013 | 81.7 | 5,881,903 | 10.7 | 9 | 789,063 | 1,066,708 | 135.2 |
| 41 | Kentucky | 207,090 | 65.9 | 2,070,375 | 10.0 | 30 | 286,203 | 548,942 | 191.8 |
| 42 | South Dakota | 42,536 | 59.6 | 429,629 | 9.9 | 46 | 56,486 | 84,046 | 148.8 |
| 43 | Alabama | 235,919 | 66.0 | 2,406,299 | 9.8 | 27 | 313,081 | 663,846 | 212.0 |
| 44 | Mississippi | 127,090 | 68.2 | 1,369,517 | 9.3 | 36 | 173,286 | 392,503 | 226.5 |
| 45 | Wyoming | 26,447 | 71.8 | 283,770 | 9.3 | 50 | 34,075 | 67,044 | 196.8 |
| 46 | Arkansas | 131,267 | 61.9 | 1,435,529 | 9.1 | 34 | 174,960 | 409,991 | 234.3 |
| 47 | Iowa | 124,779 | 63.5 | 1,467,164 | 8.5 | 37 | 174,097 | 236,020 | 135.6 |
| 48 | New York | 627,287 | 65.1 | 8,738,202 | 7.2 | 8 | 776,076 | 1,140,891 | 147.0 |
| 49 | Montana | 31,264 | 61.0 | 544,232 | 5.7 | 49 | 41,541 | 117,521 | 282.9 |
| 50 | West Virginia | 36,322 | 72.5 | 871,887 | 4.2 | 48 | 52,109 | 210,817 | 404.6 |
| 51 | District Of Columbia | 9,704 | 23.1 | 371,597 | 2.6 | 51 | 10,831 | 26,192 | 241.8 |
| United States | 21,352,930 | 66.2 | 148,228,967 | 14.4 | 27,495,475 | 35,663,034 | 129.7 |
Permits issued, not homes with PB. Units authorized are Census BPS estimates with imputation, all structure types. Share = units authorized 1980 to 1995 / ACS 2025 housing units. Survivors per 100 permits = ACS 2025 homes built 1980 to 1999 / units authorized 1980 to 1999 x 100; values above 100 indicate manufactured homes and unpermitted construction.
Source: [1][5][6] U.S. Census Bureau; U.S. Census Bureau; U.S. Census Bureau
California, Florida and Texas issued a third of all PB-era permits
California (12.6 percent), Florida (11.3 percent) and Texas (8.2 percent) together account for 6,868,906 of the 21,352,930 PB-era permits, or 32.2 percent. The Census South region accounts for 43.3 percent, and the ten largest states for 55.8 percent.
All structure types, permits issued during the polybutylene years (not homes with PB)
Source: U.S. Census Bureau, Building Permits Survey state annual files 1980 to 1995. KBR analysis.
A 2000 memo by the law firm Cozen O'Connor stated that most PB systems were believed to be installed in Florida, California and Texas, the three states with most of the litigation (Cozen O'Connor, 2000). Permits put 32.2 percent of PB-era construction in those three states. If the memo's claim is right, PB use per permitted unit in those states was well above the rate elsewhere, or the claim reflects where lawsuits were filed rather than where pipe was installed. The opened sources do not settle which.
The same memo said PB suits had been filed in 36 states by 2000. California alone issued permits for 2,691,212 units in 1980 to 1995, the largest count, but its 2025 ratio of 17.9 percent ranks ninth because its stock is the country's largest.
Two in three PB-era permits were issued in the 1980s, the acetal-fitting years
Permits for 14,295,188 units, 66.9 percent of the PB-era total, were issued in 1980 to 1989. The 1983 to 1986 boom alone accounts for 6,789,752 units, with a peak of 1,769,443 in 1986 and a low of 948,794 in 1991.
United States, thousands of units a year, 1980 to 1995
Source: U.S. Census Bureau, Building Permits Survey (US rows of state annual files); Manufactured Housing Survey shipments history. KBR analysis.
Timing matters because the fittings changed. A Pillar To Post information sheet says copper inserts and crimp rings were introduced in about 1986 after joints with plastic (acetal) inserts and aluminum crimp rings began to leak, and that the plastic fittings were not fully off the market until about 1993 (Pillar To Post). Most PB-era permits therefore predate the metal-fitting switch.
Single-family units were 14,139,460 of the PB-era permits, or 66.2 percent. The rest were apartments and other multi-unit buildings; the Cox class covered houses, condominiums, townhouses, commercial properties and mobile homes alike (Cox notice, archived).
| Year | Units authorized, all types | Units authorized (thousands) | Single-family units authorized | Manufactured home shipments (thousands) |
|---|---|---|---|---|
| 1980 | 1,190,600 | 1,190.6 | 710,390 | 221.7 |
| 1981 | 985,533 | 985.5 | 564,313 | 241.0 |
| 1982 | 1,000,485 | 1,000.5 | 546,433 | 239.6 |
| 1983 | 1,605,221 | 1,605.2 | 901,460 | 295.7 |
| 1984 | 1,681,822 | 1,681.8 | 922,447 | 295.5 |
| 1985 | 1,733,266 | 1,733.3 | 956,595 | 283.6 |
| 1986 | 1,769,443 | 1,769.4 | 1,077,596 | 244.4 |
| 1987 | 1,534,772 | 1,534.8 | 1,024,374 | 232.9 |
| 1988 | 1,455,623 | 1,455.6 | 993,772 | 218.3 |
| 1989 | 1,338,423 | 1,338.4 | 931,662 | 198.0 |
| 1990 | 1,110,766 | 1,110.8 | 793,924 | 188.1 |
| 1991 | 948,794 | 948.8 | 753,537 | 170.9 |
| 1992 | 1,094,933 | 1,094.9 | 910,679 | 210.4 |
| 1993 | 1,199,063 | 1,199.1 | 986,549 | 254.2 |
| 1994 | 1,371,637 | 1,371.6 | 1,068,461 | 304.0 |
| 1995 | 1,332,549 | 1,332.5 | 997,268 | 340.0 |
| 1980 to 1995 | 21,352,930 | 21,352.9 | 14,139,460 | 3,938.3 |
Permits from the US rows of the Census BPS state annual files; shipments are sums of monthly not seasonally adjusted values.
Manufactured homes, the PB market that permit counts miss
Manufacturers shipped 3,938.3 thousand new manufactured homes in 1980 to 1995, and Census excludes HUD-code manufactured homes from permit statistics. A 1983 industry document put PB in well over 80 percent of new mobile homes and RVs. The ACS counts 129.7 surviving 1980 to 1999 homes for every 100 units permitted in those years.
Industry material filed with an Alaska Senate committee in 1983 says PB was first used in mobile homes in 1972 and had become the main hot and cold water pipe in that industry, used in well over 80 percent of the mobile homes and recreational vehicles then produced (Alaska Legislature, SB 214 file). That is the manufacturer side's own statement. The Cox settlement gave mobile homes a shorter window: a qualifying leak within 10 years of installation and a claim within 11 years.
ACS 2025 homes built 1980 to 1999 divided by units authorized 1980 to 1999, 15 highest jurisdictions
Source: U.S. Census Bureau, ACS 2025 1-year B25034; Building Permits Survey state annual files 1980 to 1999. KBR analysis.
The cross-check shows where permits understate PB-era building. Across the United States, the ACS 2025 counts 35,663,034 homes built in 1980 to 1999 against 27,495,475 units permitted in those years. Adding 5,376.6 thousand manufactured home shipments brings the supply to 32,872,075, or 92.2 percent of the surviving count; the remaining 2,790,959 homes reflect unpermitted rural areas, misreported year built and survey error, net of demolitions.
Six jurisdictions show at least 200 surviving homes per 100 permits: West Virginia (404.6), Montana (282.9), the District of Columbia (241.8), Arkansas (234.3), Mississippi (226.5) and Alabama (212.0). In those states the permit ratio on the map understates PB-era housing. The District of Columbia has almost no manufactured housing, so its ratio more likely reflects year-built reporting than missing permits; treat it as noise.
From HUD's 1978 materials bulletins to the 2009 claim cutoff
HUD Use of Materials Bulletins for PB water distribution are dated April 25, 1978. The Cox class window ran from January 1, 1978 to July 31, 1995, and the last date to file a new Cox claim was May 1, 2009.
| Date | Event | Evidence level | Source |
|---|---|---|---|
| 1967 | Polybutylene first used commercially as a piping material, per industry material filed in Alaska | Own statement (manufacturer side) | s15 |
| 1972 | First use of PB plumbing in mobile homes, per the same material | Own statement (manufacturer side) | s15 |
| 1978-01-01 | Start of the Cox class installation window | Court record | s8 |
| 1978-04-25 | HUD Use of Materials Bulletins 76 (CPVC and PB hot and cold water) and 78 (PB cold water service) dated | Federal regulation listing | s12 |
| 1983 | Industry material says PB is in well over 80 percent of new mobile homes and RVs and approved in over 65 percent of major metro areas | Own statement (manufacturer side) | s15 |
| About 1986 | Copper inserts and crimp rings introduced as failures with acetal fittings mounted | Inspection firm summary | s21 |
| About 1993 | Plastic (acetal) fittings and aluminum crimp rings off the market | Inspection firm summary | s21 |
| 1994-10 | Proposed $750 million three-company settlement (Beeman v. Shell Oil, Harris County, Texas) | Law firm memo and newspaper report | s20, s16 |
| 1995-02 | Texas judge rejects the $750 million accord | Newspaper report | s16 |
| 1995-05 | DuPont agrees to a $120 million settlement (Spencer, Greene County, Alabama) | Newspaper report and trade press | s16, s18 |
| 1995-07-31 | End of the Cox class installation window | Court record | s8 |
| 1995-08 | Tennessee chancery court tentatively approves an $850 million Shell and Hoechst Celanese settlement | Newspaper report | s16 |
| 1995-11-17 | Court certifies the Cox class and approves the settlement; fund stated as $950 million | Court record | s8 |
| 1999-08-26 | Subsequent notice issued to buyers who purchased PB homes after August 21, 1995 | Court record | s8 |
| 1999-12-31 | Opt-out deadline in the subsequent notice | Court record | s8 |
| 2003-12-01 | Spencer opt-out deadline for buyers after August 1, 1999; 15-year limit applies to all after December 31, 2003 | Trade press summary of class notice | s18 |
| 2009-05-01 | Filing deadline for all new Cox claims expires | Archived administrator page | s10 |
| 2011-05-29 | Archived administrator page says the settlement is closed | Archived administrator page | s11 |
| 2022-02-01 | Citizens Property Insurance (Florida) rule: new-business risks over 20 years old with PB piping not insurable | Insurer bulletin | s14 |
| 2026-10-29 | ACS 2025 1-year estimates released; used here for the 2025 housing stock | Census release schedule | s6 |
Evidence level marks court records, federal listings, own statements and press reports separately.
Source: [9][11][12][13][15][16][17][19][21][22][7] Consumer Plumbing Recovery Center (court-established administrator), pbpipe.com; Consumer Plumbing Recovery Center, pbpipe.com; Consumer Plumbing Recovery Center, pbpipe.com; U.S. Department of Housing and Urban Development via eCFR; Citizens Property Insurance Corporation (Florida); Alaska State Legislature, Senate Labor and Commerce Committee; Tampa Bay Times; Contractor Magazine; Cozen O'Connor; Pillar To Post; U.S. Census Bureau
Two federal records frame the start and the present. HUD's Minimum Property Standards still list Use of Materials Bulletin 76 (CPVC and PB hot and cold water distribution) and Bulletin 78 (PB cold water service), both dated April 25, 1978 (24 CFR Part 200, Appendix A). The HUD manufactured home standard still lists ASTM D3309, the PB hot and cold water specification, among accepted plastic piping standards (24 CFR 3280.604). A listing is not evidence that PB is still sold or installed.
What Cox v. Shell paid for, and how the Spencer settlement differed
Shell Oil and Hoechst Celanese committed $950 million to the Cox fund, approved on November 17, 1995, plus $45 million in class counsel fees. DuPont's separate Spencer settlement was $120 million and paid 10 percent of replumb and leak-damage costs.
| Item | Cox v. Shell Oil (Tennessee) | Spencer v. Shell Oil (Alabama, DuPont only) |
|---|---|---|
| Court | Chancery Court for Obion County, Union City, Tennessee | Circuit Court of Greene County, Alabama |
| Paying defendants | Shell Oil and Hoechst Celanese | E. I. du Pont de Nemours only |
| Fund | $950 million (tentative $850 million in August 1995) | $120 million |
| Fees on top of fund | $45 million to class counsel | Not stated in opened sources |
| Who was covered | Owners of structures with PB plumbing or PB yard service lines installed 1978-01-01 to 1995-07-31 | Owners with PB pipe and acetal insert fittings |
| What it paid | Free replumb or yard line replacement plus unreimbursed leak expenses after qualifying leaks | 10 percent of replumb cost and 10 percent of leak damage |
| Leak window | 10 years (mobile homes, yard lines), 13 years (other structures), 16 years (single-family with metal fittings) | Replumb within 15 years of installation |
| Last filing date | 2009-05-01 for all new claims | 15-year limit applied to all members after 2003-12-31 |
| Status | Closed (administrator page, 2011) | Not stated in opened sources |
From the 1999 Cox court notice and a 2003 trade press summary of the Spencer notice. Both settlements are closed to new claims or past their limits.
Source: [9][11][12][17][19] Consumer Plumbing Recovery Center (court-established administrator), pbpipe.com; Consumer Plumbing Recovery Center, pbpipe.com; Consumer Plumbing Recovery Center, pbpipe.com; Tampa Bay Times; Contractor Magazine
The Cox fund grew from a tentatively approved $850 million in August 1995 (Tampa Bay Times, 1995) to $950 million in the court notice, a rise of 11.8 percent. An earlier $750 million three-company settlement from October 1994 had been rejected by a Texas judge in February 1995. The defendants denied, and the 1999 notice says they still denied, any legal liability relating to PB plumbing.
Cox relief depended on a qualifying leak. Single-family homes with metal insert fittings had 16 years from installation for a qualifying leak (not later than January 31, 2009) and 17 years to file (not later than May 1, 2009); other structures had 13 and 14 years. Once 80 percent of the fund was spent, replumbs took priority over cash payments (Cox notice). The Spencer settlement, filed in Greene County, Alabama, paid 10 percent of replumb cost and 10 percent of leak damage if the replumb was done within 15 years of installation (Contractor, 2003).
Six million, nine million or "several million": the published counts do not agree
Published counts of PB homes run from "several million" (the settlement administrator, 2000) to 6 million homes plus 3 million mobile homes (Cozen O'Connor, 2000). None of the opened sources gives a method. Set against Census volumes, 6 million site-built homes would equal 28.1 percent of PB-era permits, and 3 million mobile homes 76.2 percent of PB-era shipments.
| Source | Year | Published estimate | What it counts | Tier | Note |
|---|---|---|---|---|---|
| Tampa Bay Times | 1995 | About 6 million homes since 1978, half of them mobile | Site-built and mobile combined | 3 | No method given |
| Cozen O'Connor memo (W. G. Flint) | 2000 | 6 million homes plus 3 million mobile homes since 1978 | Site-built and mobile separately | 3 | No method given; 9 million combined |
| Consumer Plumbing Recovery Center FAQ | 2000 | Several million homes | Homes with PB systems or yard lines | 1 | No number |
| Pillar To Post information sheet | Uploaded 2019 | Approximately 6 million homes, apartments and mobile homes; up to 50 percent of mobile homes | Mixed | 3 | No method given |
| Industry material in Alaska SB 214 file | 1983 | Over 3 million houses and RVs in the prior ten years; well over 80 percent of new mobile homes and RVs | Houses plus RVs | 1 (record of an own statement) | Manufacturer-side claim |
| DuPont settlement coverage (Tampa Bay Times) | 1995 | As many as 930,000 homeowners | Spencer class members | 3 | Settlement estimate, not a count of PB homes |
Shown side by side, none preferred. No source gives a method.
Source: [10][16][17][21][22] Consumer Plumbing Recovery Center, pbpipe.com; Alaska State Legislature, Senate Labor and Commerce Committee; Tampa Bay Times; Cozen O'Connor; Pillar To Post
Millions of units, United States
Source: U.S. Census Bureau BPS and MHS; Cozen O'Connor (2000) for the estimates. KBR analysis.
The Tampa Bay Times reported in 1995 that the pipe had been used in about 6 million homes since 1978, half of them mobile. The Cozen O'Connor memo counts 6 million homes plus an additional 3 million mobile homes. The two agree on about 3 million mobile homes but differ on site-built homes: about 3 million in one, 6 million in the other, which would equal 14.0 or 28.1 percent of PB-era permits. The 1983 industry figure of well over 80 percent of new mobile homes fits the 3 million mobile estimate, which would equal 76.2 percent of the 3,938.3 thousand manufactured homes shipped in 1980 to 1995. Pillar To Post's "perhaps up to 50 percent" of mobile homes points lower.
Taken together, 9 million PB homes would equal 35.6 percent of the 25,291,230 units permitted or shipped in 1980 to 1995. The often repeated range of 6 to 10 million homes could not be traced to an original count in any source opened for this report; see the excluded list in the methodology.
Chlorine, crimp rings and acetal fittings: the three failure theories
No source opened for this report presents a controlled test, so the causes below are the theories recorded in litigation-era documents. They point to chlorine attacking the acetal fittings and the pipe, stress from crimping, and oxidation of the pipe itself.
The Cozen O'Connor memo lists three theories: acetal fitting resins and polybutylene deteriorate on exposure to chlorine in public water; high crimp force put excess stress on pipe and fittings; and the pipe broke down early through oxidation. In 1995 a Hoechst representative told reporters the pipes leaked because they could not resist chemicals added to water in many parts of the country (Tampa Bay Times).
Red River Mutual, a property insurer, lists chlorine and other water chemicals, pipe age and faulty installation as contributing factors and notes that failures start inside the pipe, so condition cannot be judged by looking (Red River Mutual). The 1983 industry material had projected a normal life of at least 50 years. For how long the replacement materials last, see how long copper pipes last.
Florida's insurer of last resort stopped writing older PB homes in 2022
Citizens Property Insurance Corporation rule 206.B, for new business from February 1, 2022, makes risks over 20 years old with polybutylene piping uninsurable by Citizens. In 2026 the youngest home in the Cox installation window is 31 years old.
Citizens' April 2022 agent bulletin states that new-business risks over 20 years old with polybutylene piping are not insurable by Citizens under rule 206.B for its HO-3 and HO-8 forms (Citizens, 2022). Because the Cox window closed on July 31, 1995, every home plumbed with PB in that window passed the 20-year mark by 2015.
In 2023 Citizens told NBC 6 South Florida that, like most of the insurance industry, it does not insure properties with polybutylene piping, and Florida's Office of Insurance Regulation said an insurer may consider the age of a home's plumbing when offering coverage (NBC 6, 2023). Florida issued permits for 2,420,864 units in the PB years, the second highest count, which is why the rule touches a large share of older Florida housing. This report is not legal, insurance or real estate advice. State figures are permits issued or homes built during the PB years, never counts of homes with polybutylene.
What a PB-era permit count can tell a kitchen or bath remodeler
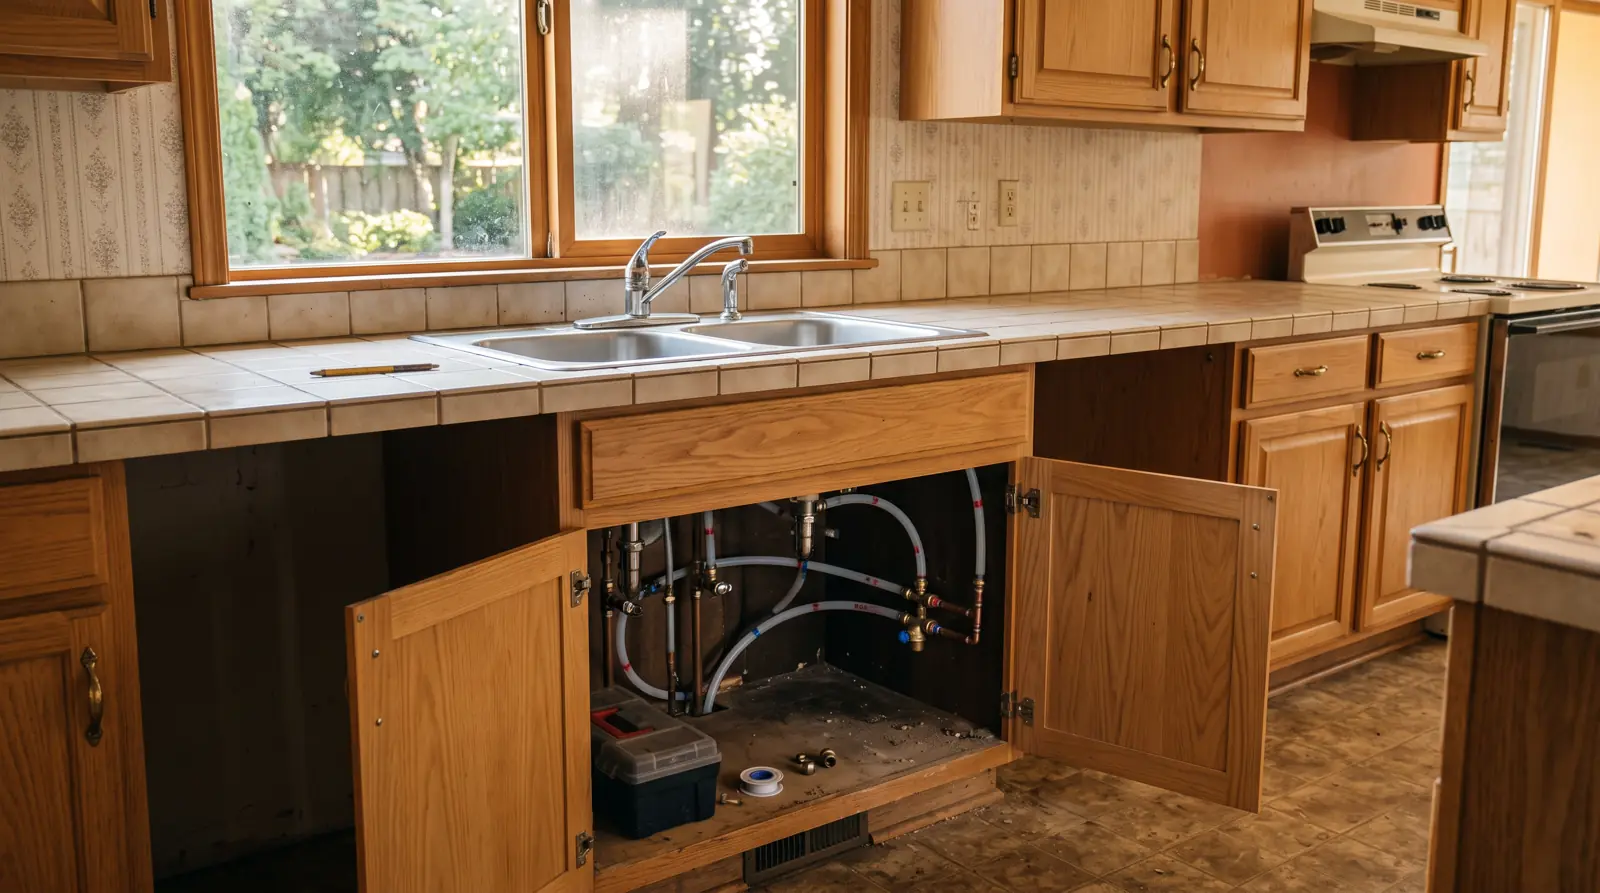
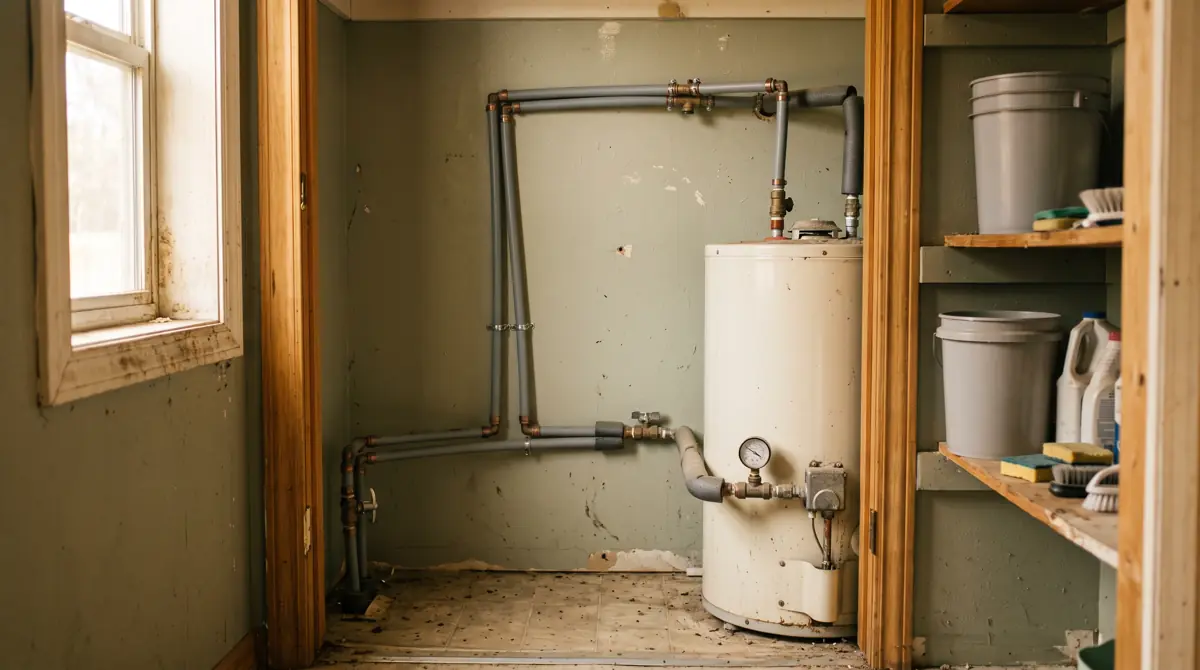
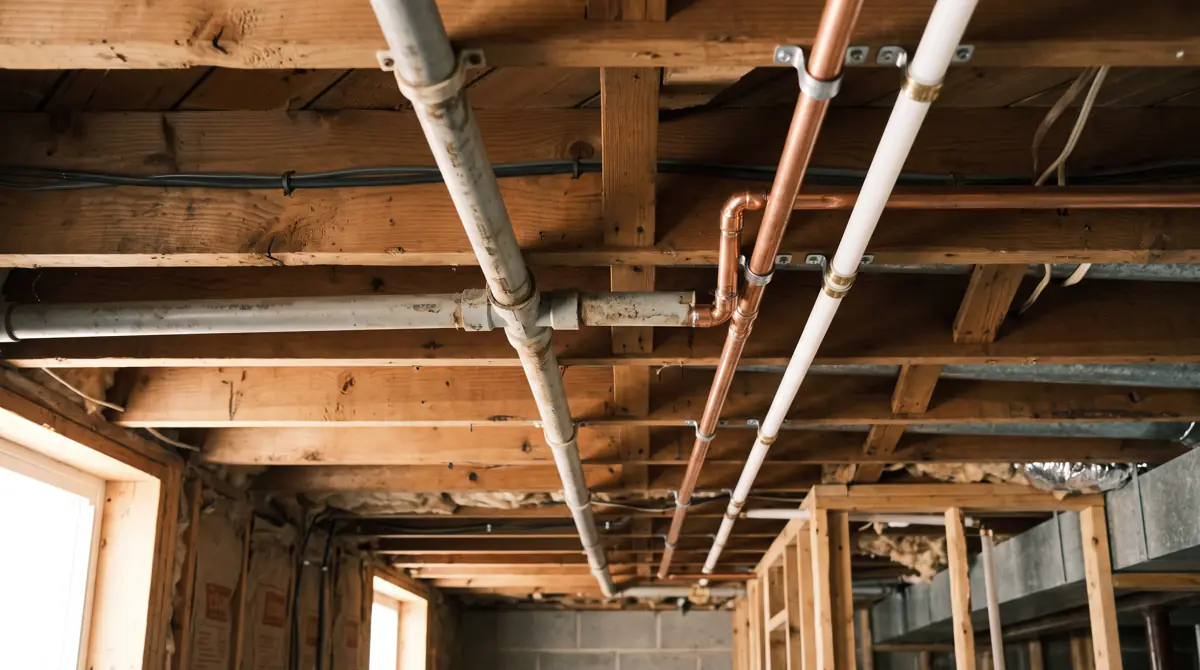
A home built or replumbed in 1978 to 1995 is a candidate for PB; a permit ratio only says how common such homes are in a state. The Cox notice describes what to look for: flexible gray, silver or black supply pipe indoors and blue, gray or black yard service lines.
The Cox notice defines PB plumbing as a potable water supply system of flexible PB pipe joined by acetal (hard gray or white plastic) or copper or brass insert fittings, clamped with aluminum or copper crimp rings. PB was not used for drain, waste or vent pipe (Cox notice). Pillar To Post notes that rigid plastic pipe with glued joints is PVC or CPVC, and that PEX, often red or blue, is a different material that can be mistaken for PB.
Supply lines are easiest to inspect when walls are open, which is why repiping questions often surface during a bathroom or kitchen project. For budgeting context see the bathroom remodel cost guide and the kitchen remodel timeline, and for vetting a plumber or remodeler see how to choose a remodeling contractor. Related KBR research: water damage statistics, how old is my house and the lead pipes map.
State-by-state findings
- Building permits were issued for 21,352,930 US housing units in 1980 to 1995 (Census BPS state annual files).[1]
- PB-era permits equal 14.4 percent of the 148,228,967 US housing units in the ACS 2025 1-year estimates.[1][5]
- Nevada's 316,438 PB-era permits equal 22.8 percent of its 1,385,027 housing units in 2025, the highest state share.[1][5]
- Florida's 2,420,864 PB-era permits equal 22.4 percent of its 10,788,709 housing units in 2025.[1][5]
- California (2,691,212), Florida and Texas (1,756,830) together issued 32.2 percent of US permits in 1980 to 1995.[1]
- Permits for 14,295,188 units, 66.9 percent of the 1980 to 1995 total, were issued in the 1980s; the annual peak was 1,769,443 in 1986.[1]
- Manufacturers shipped 3,938.3 thousand new manufactured homes in the United States in 1980 to 1995 (Census MHS).[8]
- Nationally, the ACS 2025 counts 129.7 surviving homes built in 1980 to 1999 per 100 units permitted in those years; West Virginia shows 404.6.[1][6]
- HUD Use of Materials Bulletins 76 and 78 for PB water piping are dated April 25, 1978 (24 CFR Part 200, Appendix A).[13]
- The Cox v. Shell Oil settlement fund was $950 million, with $45 million in class counsel fees paid on top (Obion County Chancery Court notice, 1999).[9]
- DuPont's Spencer settlement of $120 million paid 10 percent of replumb and leak-damage costs.[17][19]
- The filing deadline for all new Cox claims expired on May 1, 2009 (archived CPRC page).[11]
- Citizens Property Insurance (Florida) rule 206.B, effective February 1, 2022, makes new-business risks over 20 years old with PB piping uninsurable by Citizens.[15]
- Industry material filed in Alaska in 1983 said PB was used in well over 80 percent of new mobile homes and RVs.[16]
Rankings and ratios we derived
PB-era permits as a share of the 2025 housing stock (signature figure)
Formulasum of housing units authorized 1980 to 1995 / ACS 2025 B25001 housing units x 100, nationally and for each state
Inputs: fact_sheet US permit rows 1980 to 1995; state permit rows; ACS 2025 total housing unit rows; derived d1, d3 (fact sheet rows)
Result: United States 14.4 percent (21,352,930 / 148,228,967); Nevada 22.8; Florida 22.4; Virginia 20.9; Arizona 20.8; Hawaii 20.6; lowest District of Columbia 2.6
The ratio shows how much of each state's housing was permitted while PB was sold. It is highest in fast-growing 1980s markets that slowed afterwards, and lower in Texas (13.7 percent), which kept building.
Limitations: A flow of permits divided by a current stock; demolished or never-built units stay in the numerator; manufactured homes and unpermitted areas are missing; PB presence is unknown.
Concentration of PB-era permits
Formula(CA + FL + TX permits 1980 to 1995) / US permits 1980 to 1995 x 100; same for the Census South and the ten largest states
Inputs: fact_sheet state permit rows; d1 (fact sheet rows)
Result: California, Florida and Texas 32.2 percent (6,868,906 units); Census South 43.3 percent; ten largest states 55.8 percent
Litigation-era claims that most PB went into Florida, California and Texas would require PB rates in those states far above other states.
Limitations: Permits only; PB adoption by state is not recorded.
Survivors per 100 permits (cross-check)
FormulaACS 2025 B25034 homes built 1980 to 1999 / units authorized 1980 to 1999 x 100
Inputs: fact_sheet ACS built rows and permit rows 1980 to 1999 (fact sheet rows)
Result: United States 129.7; West Virginia 404.6; Montana 282.9; District of Columbia 241.8; Arkansas 234.3; Mississippi 226.5; Alabama 212.0
Ratios above 100 flag homes that permits never counted, chiefly manufactured homes and rural areas without permit systems. Where the ratio is high, the permit map understates PB-era housing.
Limitations: ACS year built is respondent-reported and decade bins do not match 1995; survey sampling error applies.
Permits plus manufactured home shipments against surviving homes
Formula(permits 1980 to 1999 + MH shipments 1980 to 1999) / ACS 2025 homes built 1980 to 1999 x 100
Inputs: d10; d11 inputs (fact sheet rows)
Result: 32,872,075 units supplied; 92.2 percent of the surviving count; residual 2,790,959 (7.8 percent)
Manufactured homes close most of the gap between permits and surviving homes.
Limitations: Shipments are not placements; residual mixes several error sources.
What the published estimates imply
Formula6,000,000 / PB-era permits; 3,000,000 / MH shipments 1980 to 1995; 9,000,000 / (permits + shipments)
Inputs: fact_sheet estimate rows; d1; d10 (fact sheet rows)
Result: 6 million site-built: 28.1 percent of permitted units (3 million site-built: 14.0 percent); 3 million mobile: 76.2 percent of manufactured homes; 9 million: 35.6 percent of 25,291,230 combined units
The 1995 and 2000 estimates agree on about 3 million mobile homes, which fits the 1983 industry claim of well over 80 percent of new mobile homes; they disagree on site-built homes by a factor of two.
Limitations: Estimates start in 1978 while the denominators start in 1980, so the implied rates are upper bounds.
PB-era homes against Citizens' 20-year rule
Formula2026 minus 1995 (end of the Cox installation window)
Inputs: fact_sheet Cox class window; Citizens rule row (fact sheet rows)
Result: 31 years: every home in the Cox window is past Citizens' 20-year threshold
Rule 206.B reaches every unreplaced PB system in a home seeking new Citizens coverage.
Limitations: Applies to Citizens new business only; other insurers set their own rules.
Executive summary
- Permits were issued for 21,352,930 US housing units in 1980 to 1995, equal to 14.4 percent of the 148,228,967 units in the 2025 ACS.
- Nevada (22.8 percent), Florida (22.4 percent), Virginia (20.9 percent), Arizona (20.8 percent) and Hawaii (20.6 percent) have the highest PB-era shares.
- California, Florida and Texas issued 32.2 percent of PB-era permits; Texas built so much afterwards that its share of today's stock is 13.7 percent.
- Manufactured homes, which permit counts omit, added 3,938.3 thousand shipments in 1980 to 1995, and a 1983 industry document put PB in well over 80 percent of new mobile homes and RVs.
- The Cox v. Shell settlement committed $950 million for PB installed from January 1, 1978 to July 31, 1995; new claims closed on May 1, 2009.
- Published counts of PB homes range from "several million" to 6 million homes plus 3 million mobile homes, with no stated method.
- Since February 1, 2022, Florida's Citizens Property Insurance will not write new policies on homes over 20 years old with PB piping.
Questions people ask
Is polybutylene pipe still a problem?
For insurance, yes in Florida: since February 1, 2022 Citizens will not write new HO-3 or HO-8 policies on homes over 20 years old with PB piping, and the youngest home in the Cox window is 31 years old in 2026. The Cox settlement that once paid for replumbs stopped taking new claims on May 1, 2009.
How do I identify polybutylene pipe?
The Cox court notice describes indoor PB as flexible, usually gray (or silver or black) plastic supply pipe joined by insert fittings and aluminum or copper crimp rings; outdoor yard service lines are blue, gray or black. PB was not used for drains, waste or vents. Rigid glued plastic is PVC or CPVC, and red or blue PEX is a different material.
Does insurance cover polybutylene pipe?
It depends on the insurer. Citizens in Florida bars new-business risks over 20 years old with PB piping under rule 206.B, and Florida's regulator told NBC 6 in 2023 that insurers may weigh the age of plumbing. This report is not legal, insurance or real estate advice. State figures are permits issued or homes built during the PB years, never counts of homes with polybutylene.
Do I have to replace polybutylene before selling?
No federal rule requiring replacement before a sale was found in the sources opened for this report, and state disclosure laws were not reviewed. Practical pressure comes from buyers' insurers, such as Citizens' 20-year rule, and from lenders that require insurance. This report is not legal, insurance or real estate advice. State figures are permits issued or homes built during the PB years, never counts of homes with polybutylene.
What years was polybutylene pipe used?
The Cox settlement class covered PB installed from January 1, 1978 to July 31, 1995, and HUD materials bulletins for PB water piping are dated April 25, 1978. Industry material says PB entered mobile homes in 1972. Census permits show 21,352,930 units authorized in 1980 to 1995.
Download the data
Every table in this report is available as a CSV under CC BY 4.0. The fact sheet lists each value with its source URL and access date.
- derived_metrics.csv (CSV)
- fact_sheet.csv (CSV)
- t1_state_atlas.csv (CSV)
- t2_timeline.csv (CSV)
- t3_settlements.csv (CSV)
- t4_estimates.csv (CSV)
- t5_national_by_year.csv (CSV)
For journalists and researchers
If you cite only a few, cite these
- 21,352,930 US housing units were permitted in 1980 to 1995, equal to 14.4 percent of the 2025 housing stock.[1][5]
- Nevada (22.8 percent) and Florida (22.4 percent) have the highest PB-era shares of their 2025 housing stock.[1][5]
- The Cox v. Shell Oil fund was $950 million; new claims closed May 1, 2009.[9][11]
Most quotable statistics
- US building permits authorized 21,352,930 housing units in 1980 to 1995, the polybutylene years, equal to 14.4 percent of the 2025 housing stock (KBR analysis of Census BPS and ACS 2025).[1][5]
- Nevada's PB-era permits equal 22.8 percent of its 2025 housing stock, the highest state share; Florida follows at 22.4 percent.[1][5]
- California, Florida and Texas issued 32.2 percent of the US permits of 1980 to 1995.[1]
- The Cox v. Shell Oil settlement committed $950 million for PB plumbing installed from January 1, 1978 to July 31, 1995.[9]
- New claims under the Cox polybutylene settlement closed on May 1, 2009.[11]
- Since February 1, 2022, Florida's Citizens Property Insurance will not write new policies on homes over 20 years old with polybutylene piping.[15]
Press summary
A new state atlas from Kitchen and Bath Renovators measures how much US housing was built during the polybutylene pipe years. Census building permit files show 21,352,930 housing units authorized in 1980 to 1995, equal to 14.4 percent of the 148,228,967 units in the ACS 2025 estimates released October 29, 2026. Nevada (22.8 percent) and Florida (22.4 percent) have the highest shares, while California, Florida and Texas together issued 32.2 percent of the permits. Manufactured homes, which permits omit, added 3,938.3 thousand shipments, and a 1983 industry document put PB in well over 80 percent of new mobile homes. The report sets out the Cox v. Shell Oil settlement terms ($950 million fund, claims closed May 1, 2009), DuPont's $120 million Spencer settlement, and Florida's Citizens rule barring new policies on homes over 20 years old with PB. State figures are permits issued, not homes with PB.
Suggested headlines
- One in seven US homes standing today was permitted during the polybutylene pipe years
- Nevada and Florida lead a new state atlas of PB-era housing
- California, Florida and Texas issued a third of polybutylene-era building permits
- Polybutylene settlement closed in 2009, but Florida's insurer of last resort still screens for the pipe
- Published counts of polybutylene homes range from several million to 9 million, with no method behind them
How to cite this report
Kitchen and Bath Renovators. (2026). Polybutylene Pipe: Where It Was Installed and How Much Housing Dates From the PB Years. Retrieved from https://kitchenandbathrenovators.com/research/polybutylene-pipe/
Reuse license
Data and tables are licensed CC BY 4.0. Attribution: “Source: Kitchen and Bath Renovators, Polybutylene Pipe: Where It Was Installed and How Much Housing Dates From the PB Years” with a link to this page.
Frequently asked questions
What is polybutylene pipe?
Polybutylene (PB) pipe is a flexible plastic water supply pipe, joined with plastic (acetal) or metal insert fittings and crimp rings, that was installed in US homes in the late 1970s to mid 1990s. The Cox settlement class window ran from January 1, 1978 to July 31, 1995.
Can I still file a claim under the polybutylene settlement?
No. The Consumer Plumbing Recovery Center posted that the filing deadline for all new Cox v. Shell claims expired on May 1, 2009, and a 2011 capture of its site says the settlement is closed.
How much was the polybutylene class action settlement?
The Cox v. Shell Oil fund was $950 million, with $45 million in class counsel fees paid separately. DuPont's Spencer settlement was $120 million.
Which states have the most polybutylene pipe?
No agency counts homes with PB. By permits issued in 1980 to 1995, California leads with 2,691,212 units; as a share of the 2025 stock, Nevada leads at 22.8 percent and Florida follows at 22.4 percent.
Was polybutylene used in mobile homes?
Yes. Industry material filed in Alaska in 1983 said PB was used in well over 80 percent of new mobile homes and RVs, and 3,938.3 thousand manufactured homes were shipped in 1980 to 1995.
How many homes have polybutylene plumbing?
Published estimates run from "several million" (CPRC, 2000) to 6 million homes plus 3 million mobile homes (Cozen O'Connor, 2000). None gives a method, and none counts replumbed homes.
Why did polybutylene pipe fail?
Litigation-era documents record three theories: chlorine in treated water degrading acetal fittings and the pipe, stress from crimping, and oxidation of the pipe. The defendants denied liability.
Does HUD still list polybutylene in its standards?
Yes. The current eCFR text of 24 CFR 3280.604 lists ASTM D3309 for PB hot and cold water systems in manufactured homes, and 24 CFR Part 200 still lists the April 25, 1978 PB materials bulletins. A listing does not show current use.
What share of US housing was permitted during the polybutylene years?
Permits issued in 1980 to 1995 equal 14.4 percent of the 2025 US housing stock of 148,228,967 units, and 19 jurisdictions are at or above that level.
Is polybutylene used for drain pipes?
No. The Cox court notice states PB pipe is not used for drain, waste or vent pipe; it was a water supply material, inside the house and in yard service lines.
Reproduce this analysis
Every figure comes from the files below. The scripts that pulled and computed them are kept with the report and can be re-run.
| Dataset | Publisher | Source | Query or filter | Rows used | Retrieved |
|---|---|---|---|---|---|
| Building Permits Survey, state annual files | U.S. Census Bureau | File or endpoint | Columns 7, 10, 13, 16 (units: 1-unit, 2-unit, 3-4 unit, 5+ unit, estimates with imputation); rows with a two-digit state FIPS code and the US row | 51 state and DC rows plus the US row in each of 20 annual files; 1980 to 1995 used for the PB window | 2026-11-01 |
| ACS 2025 1-year table-based summary file, B25001 | U.S. Census Bureau | File or endpoint | GEO_ID 0100000US and 0400000US01 to 0400000US56; B25001_E001 | 52 rows (US, 50 states, DC) | 2026-11-01 |
| ACS 2025 1-year table-based summary file, B25034 | U.S. Census Bureau | File or endpoint | Same geographies; B25034_E005 (built 1990 to 1999) + B25034_E006 (built 1980 to 1989), labels checked in ACS20251YR_Table_Shells.txt | 52 rows | 2026-11-01 |
| Manufactured Housing Survey, shipments of new manufactured homes 1959 to 2020 | U.S. Census Bureau | File or endpoint | Not seasonally adjusted monthly column, summed by year for 1980 to 1999 | 12 monthly values per year for 1980 to 1999 | 2026-11-01 |
| Cox v. Shell Oil notice and CPRC pages (Internet Archive captures) | Consumer Plumbing Recovery Center via Internet Archive | File or endpoint | Notice long form (1999), FAQ (2000 capture), home page captures of 2009-08-04 and 2011-05-29 | 4 pages | 2026-11-01 |
Data quality and exclusions
- Used the 'estimates with imputation' columns of the BPS files, not the 'reported only' columns; for 1980 the reported-only US single-family count is 692,834 against 710,390 with imputation.
- Dropped 13 region and division rows per BPS file (4 regions, 9 divisions) and kept 51 state and DC rows plus the US row; the 51 state totals sum exactly to the US total of 21,352,930 for 1980 to 1995.
- Excluded Puerto Rico and the Virgin Islands, which appear in recent BPS files but not in the 1980 to 1999 series, and Puerto Rico's ACS row.
- Kept only GEO_ID rows for the US, 50 states and DC from the ACS .dat files (52 rows each) and discarded all other summary levels.
- Summed 12 monthly manufactured home shipment values per year (in thousands, as published, one decimal) instead of using seasonally adjusted annual rates.
- Read the Cox notice, FAQ and settlement status from Internet Archive captures because the live pbpipe.com domain now shows a registrar parking page; each capture is labelled with its date.
- Did not use FindLaw, InterNACHI, ASTM or the Solvay PDF because they refused automated access (HTTP Forbidden); facts that depended on them were dropped.
Methodology
Source selection: Census Building Permits Survey state annual files (st1980a.txt to st1999a.txt) for construction during the PB years, ACS 2025 1-year tables B25001 and B25034 from the table-based summary file (the newest release, published October 29, 2026; the ACS API returned no data without a key), and the Census Manufactured Housing Survey shipments history. Settlement terms come from the Cox court notice and administrator pages, read through labelled Internet Archive captures because pbpipe.com is now a parked domain. Federal acceptance comes from the eCFR. Press reports and a law firm memo are used only for dated events and for published estimates, which are shown side by side.
Inclusion and exclusion: the PB window is 1980 to 1995 because the state annual permit series starts in 1980 and the Cox class window ends July 31, 1995; 1978 and 1979 permits and the August to December 1995 permits that fall outside the class window are noted as limits rather than estimated. Units are the 'estimates with imputation' columns for all structure types. Puerto Rico and territories are excluded. Claims that could not be traced to an opened source, including the widely repeated 6 to 10 million range, a 320,000 replumbed homes figure and the PB2110 pipe marking, are listed in excluded.md.
Conflicting numbers: the Cox fund appears as $850 million (tentative, August 1995) and $950 million (court notice); the report uses the court notice and shows the change. Mobile home shares of 50 percent, half, and well over 80 percent are shown with their sources rather than reconciled.
Derived metrics: PB-era share of stock = units authorized 1980 to 1995 / ACS 2025 housing units; survivors per 100 permits = ACS homes built 1980 to 1999 / units authorized 1980 to 1999; concentration and implied-rate metrics as listed in derived_metrics.csv. All are reproducible with scripts/build_data.py and scripts/compose_data.py from the files in raw/.
Limitations: permits are authorizations, not completions, and do not record plumbing material; the permit universe grew from about 16,000 places (1978 to 1983) to about 17,000 (1984 to 1993) and about 19,000 (1994 onward), so early-year counts cover fewer places; manufactured homes and unpermitted areas are missing; ACS figures carry sampling error.
Last updated 2026-11-01. The atlas will be refreshed when the ACS 2026 1-year estimates are released.
This report presents published data with its limitations. It is not legal, financial or investment advice.
Sources, ranked by quality
Tier 1: primary and official sources (16)
- [1] U.S. Census Bureau. Building Permits Survey, state annual files st1980a.txt to st1999a.txt (estimates with imputation). 1980 to 1999, annual. Accessed 2026-11-01.
- [2] U.S. Census Bureau. Building Permits Survey: Methodology (universe of permit-issuing places, imputation). Universe history 1959 to 2023. Accessed 2026-11-01.
- [3] U.S. Census Bureau. Residential Building Permits Survey Documentation: State ASCII Files (February 9, 2022). File layout. Accessed 2026-11-01.
- [4] U.S. Census Bureau. Building Permits Survey: Definitions (housing unit, new residential construction coverage). Current definitions. Accessed 2026-11-01.
- [5] U.S. Census Bureau. American Community Survey 2025 1-year, Table B25001 Housing Units (table-based summary file). 2025 (released October 29, 2026). Accessed 2026-11-01.
- [6] U.S. Census Bureau. American Community Survey 2025 1-year, Table B25034 Year Structure Built (table-based summary file). 2025 (released October 29, 2026). Accessed 2026-11-01.
- [7] U.S. Census Bureau. 2025 ACS Data Release Schedule (updated October 29, 2026). 2025 ACS releases. Accessed 2026-11-01.
- [8] U.S. Census Bureau. Manufactured Housing Survey: Shipments of New Manufactured Homes, 1959 to 2020 (shiphist.xlsx). 1980 to 1999 used, monthly not seasonally adjusted. Accessed 2026-11-01.
- [9] Consumer Plumbing Recovery Center (court-established administrator), pbpipe.com. Notice of Class Action and Settlement, Cox v. Shell Oil Co., Civil Action 18,844, Chancery Court for Obion County, Tennessee (dated August 26, 1999), Internet Archive capture of the official page (labelled archive copy). Settlement approved November 17, 1995; notice August 26, 1999. Accessed 2026-11-01.
- [10] Consumer Plumbing Recovery Center, pbpipe.com. CPRC Frequently Asked Questions, Internet Archive capture of the official page (labelled archive copy). Captured October 3, 2000. Accessed 2026-11-01.
- [11] Consumer Plumbing Recovery Center, pbpipe.com. The Polybutylene Pipe Settlement Fund home page (filing deadline notice), Internet Archive capture of the official page (labelled archive copy). Captured August 4, 2009. Accessed 2026-11-01.
- [12] Consumer Plumbing Recovery Center, pbpipe.com. The Polybutylene Pipe Settlement Fund home page (settlement closed), Internet Archive capture of the official page (labelled archive copy). Captured May 29, 2011. Accessed 2026-11-01.
- [13] U.S. Department of Housing and Urban Development via eCFR. 24 CFR Part 200, Appendix A: Standards Incorporated by Reference in the Minimum Property Standards (Use of Materials Bulletins 76 and 78). eCFR current as of October 29, 2026. Accessed 2026-11-01.
- [14] U.S. Department of Housing and Urban Development via eCFR. 24 CFR 3280.604 Materials (Manufactured Home Construction and Safety Standards, plumbing). eCFR current as of October 29, 2026. Accessed 2026-11-01.
- [15] Citizens Property Insurance Corporation (Florida). Clarification of February 1, 2022, Eligibility Rules (agent bulletin, April 28, 2022). Rules effective February 1, 2022. Accessed 2026-11-01.
- [16] Alaska State Legislature, Senate Labor and Commerce Committee. Senate Bill 214 committee file, 'An act relating to the plumbing code' (includes polybutylene industry materials filed with the committee). 1983. Accessed 2026-11-01.
Tier 2: trade bodies, market research, company data (1)
- [23] Red River Mutual. Safety guide: Plumbing, Polybutylene. Page copyright 2026. Accessed 2026-11-01.
Tier 3: journalism and expert commentary (6)
- [17] Tampa Bay Times. Plumbing suit deal okayed, may not last (archive, August 2, 1995). 1995. Accessed 2026-11-01.
- [18] The Seattle Times. Someone Besides You May Be Responsible For Those Leaky Pipes (October 31, 1998). 1998. Accessed 2026-11-01.
- [19] Contractor Magazine. Polybute Settlement Money Still Available (October 1, 2003). 2003. Accessed 2026-11-01.
- [20] NBC 6 South Florida. Does Your Home Have Poly Pipes? Getting Insurance May Be Difficult (March 13, 2023). 2023. Accessed 2026-11-01.
- [21] Cozen O'Connor. Polybutylene Pipes and Plumbing Systems (William G. Flint, 2000). 2000. Accessed 2026-11-01.
- [22] Pillar To Post. Polybutylene Pipe (Information Series V1.0). Undated, uploaded January 2019. Accessed 2026-11-01.